Monitor data
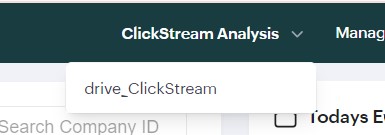
From the header, select clickstream you want to monitor / visualize.
We have 13 visualization sections in the click-stream app, they are as follows:
- Location based Traffic
- Real-Time Stats
- Visit Trends
- Page Stats
- Page Event Analysis
- Traffic Analysis
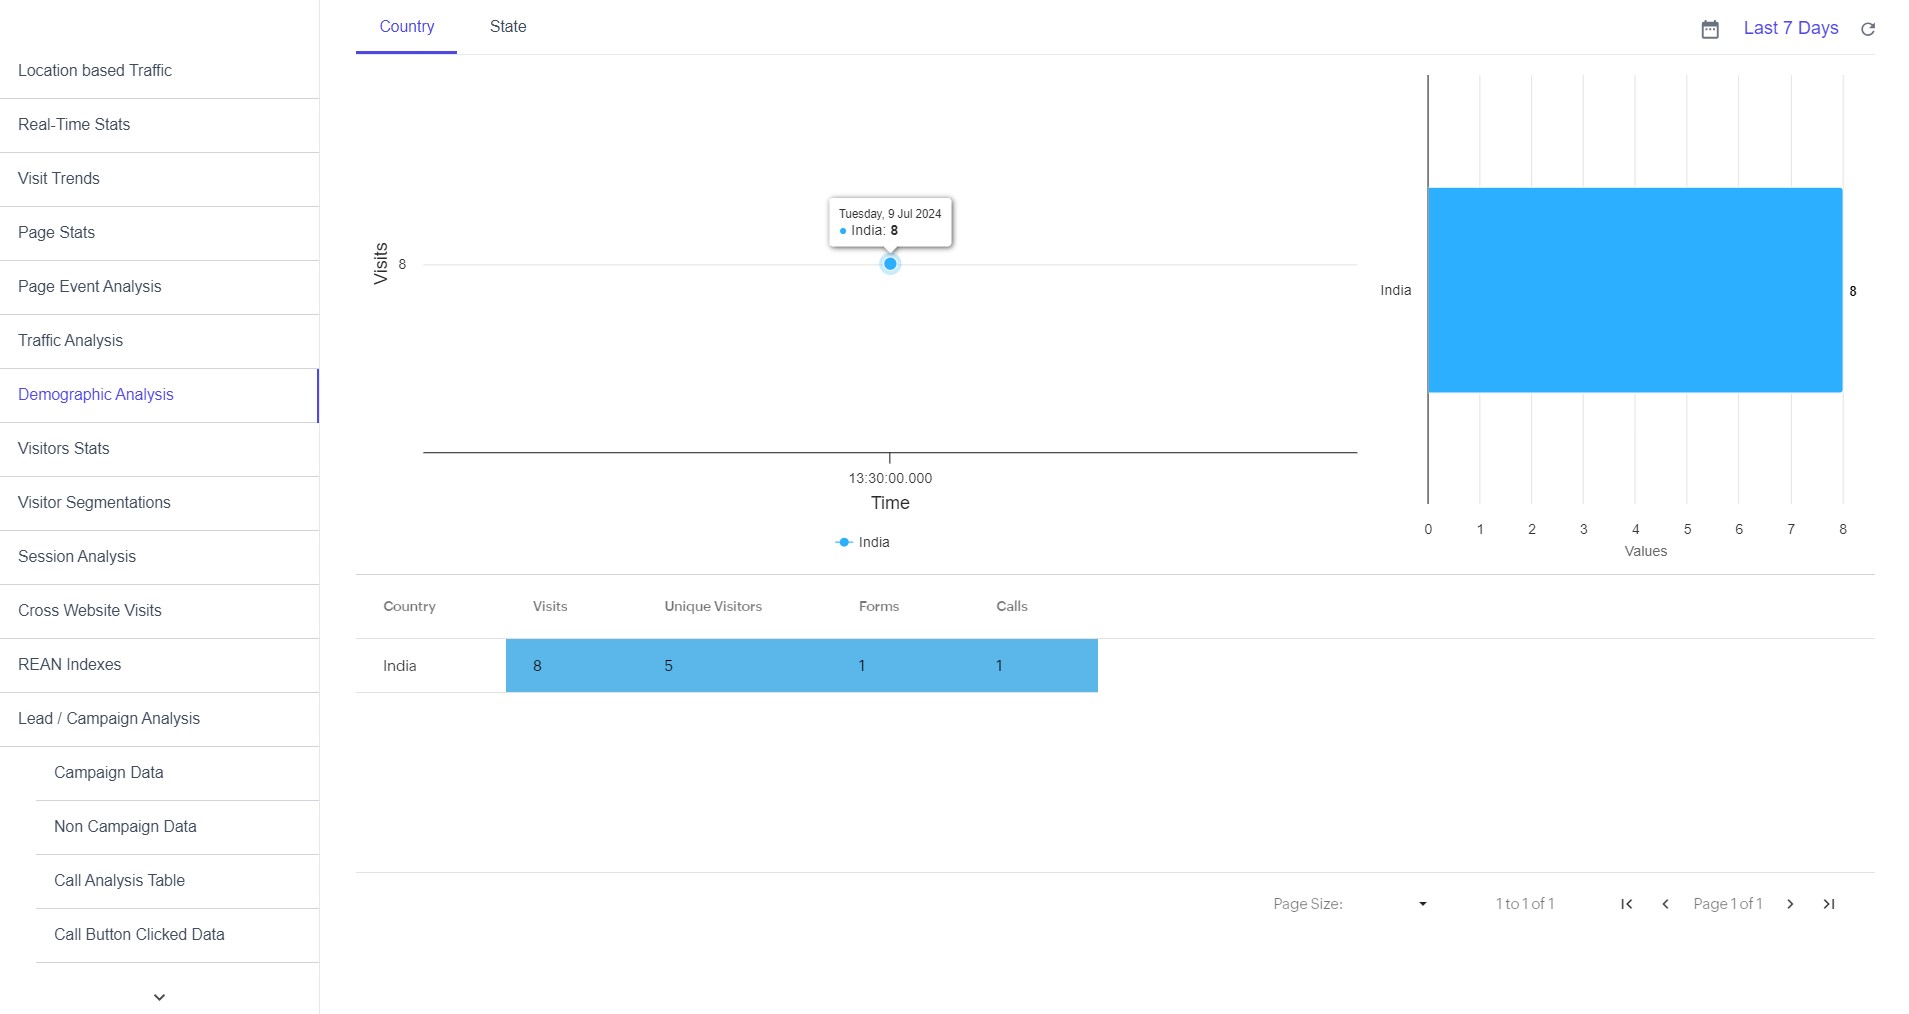
- Demographic Analysis
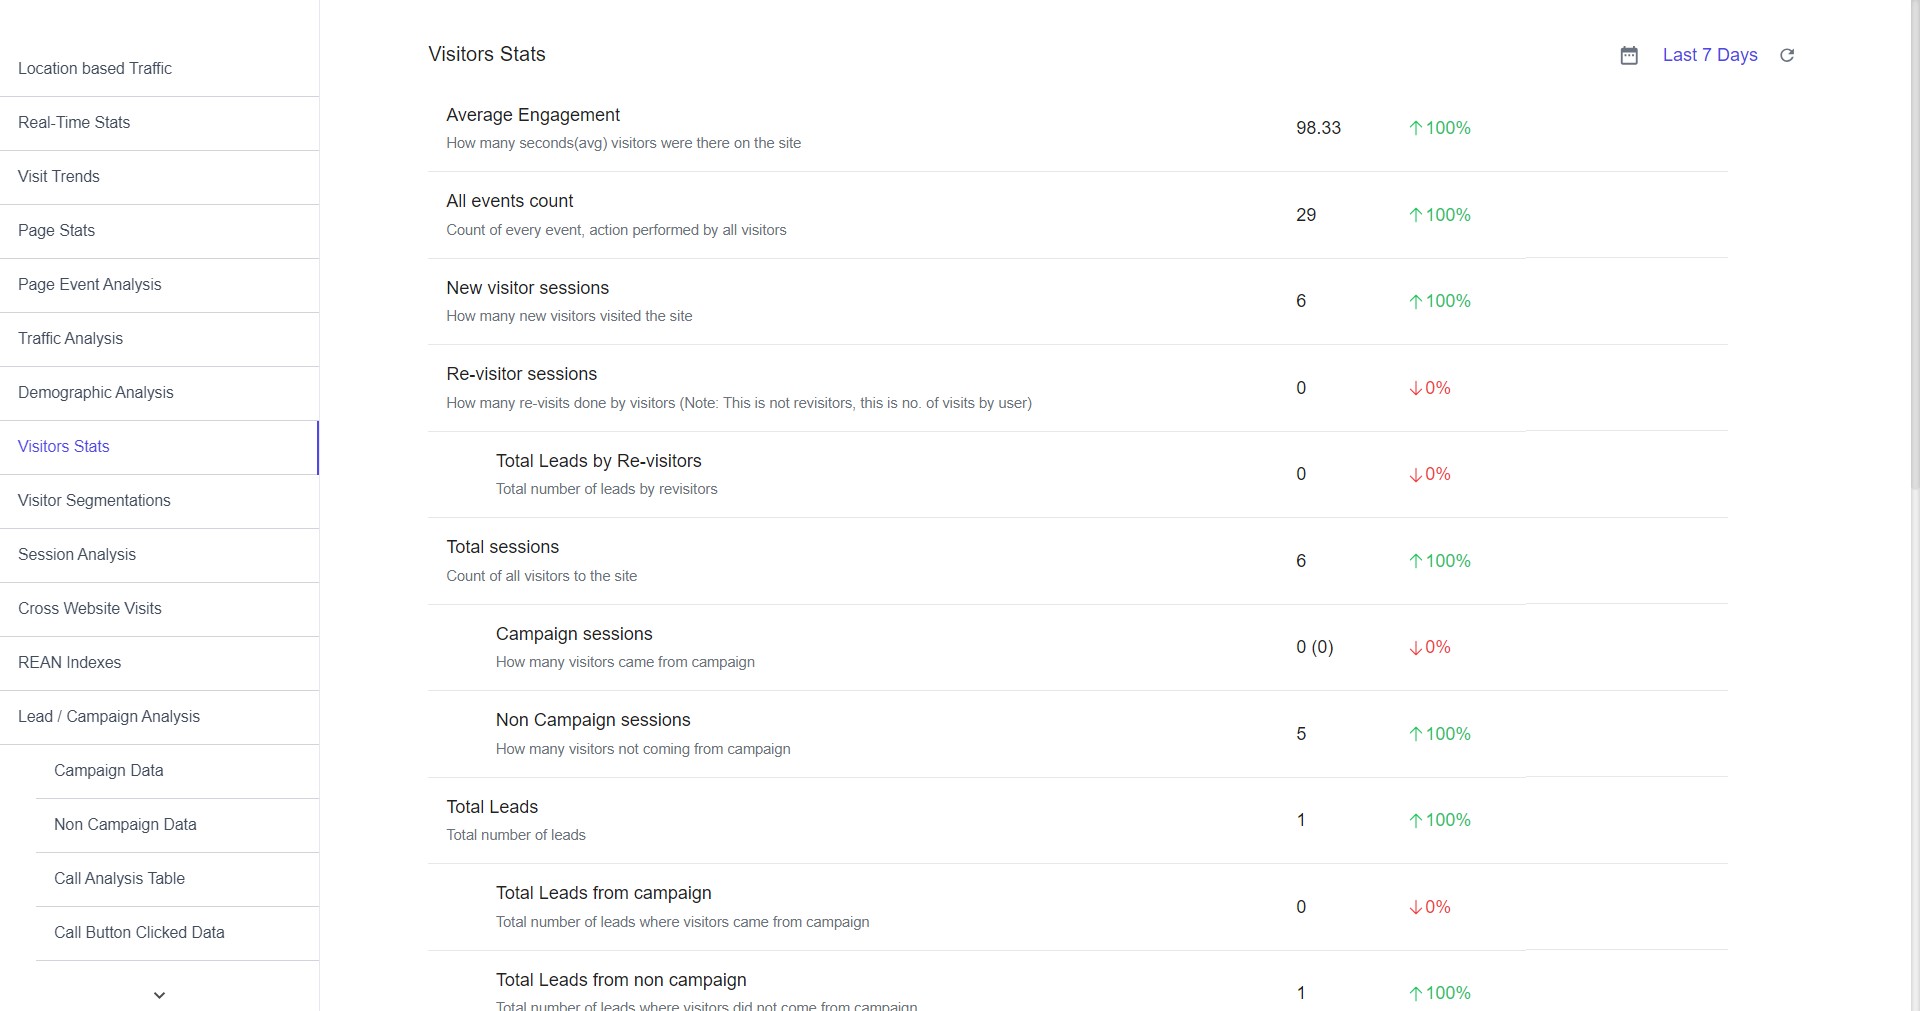
- Visitor Stats
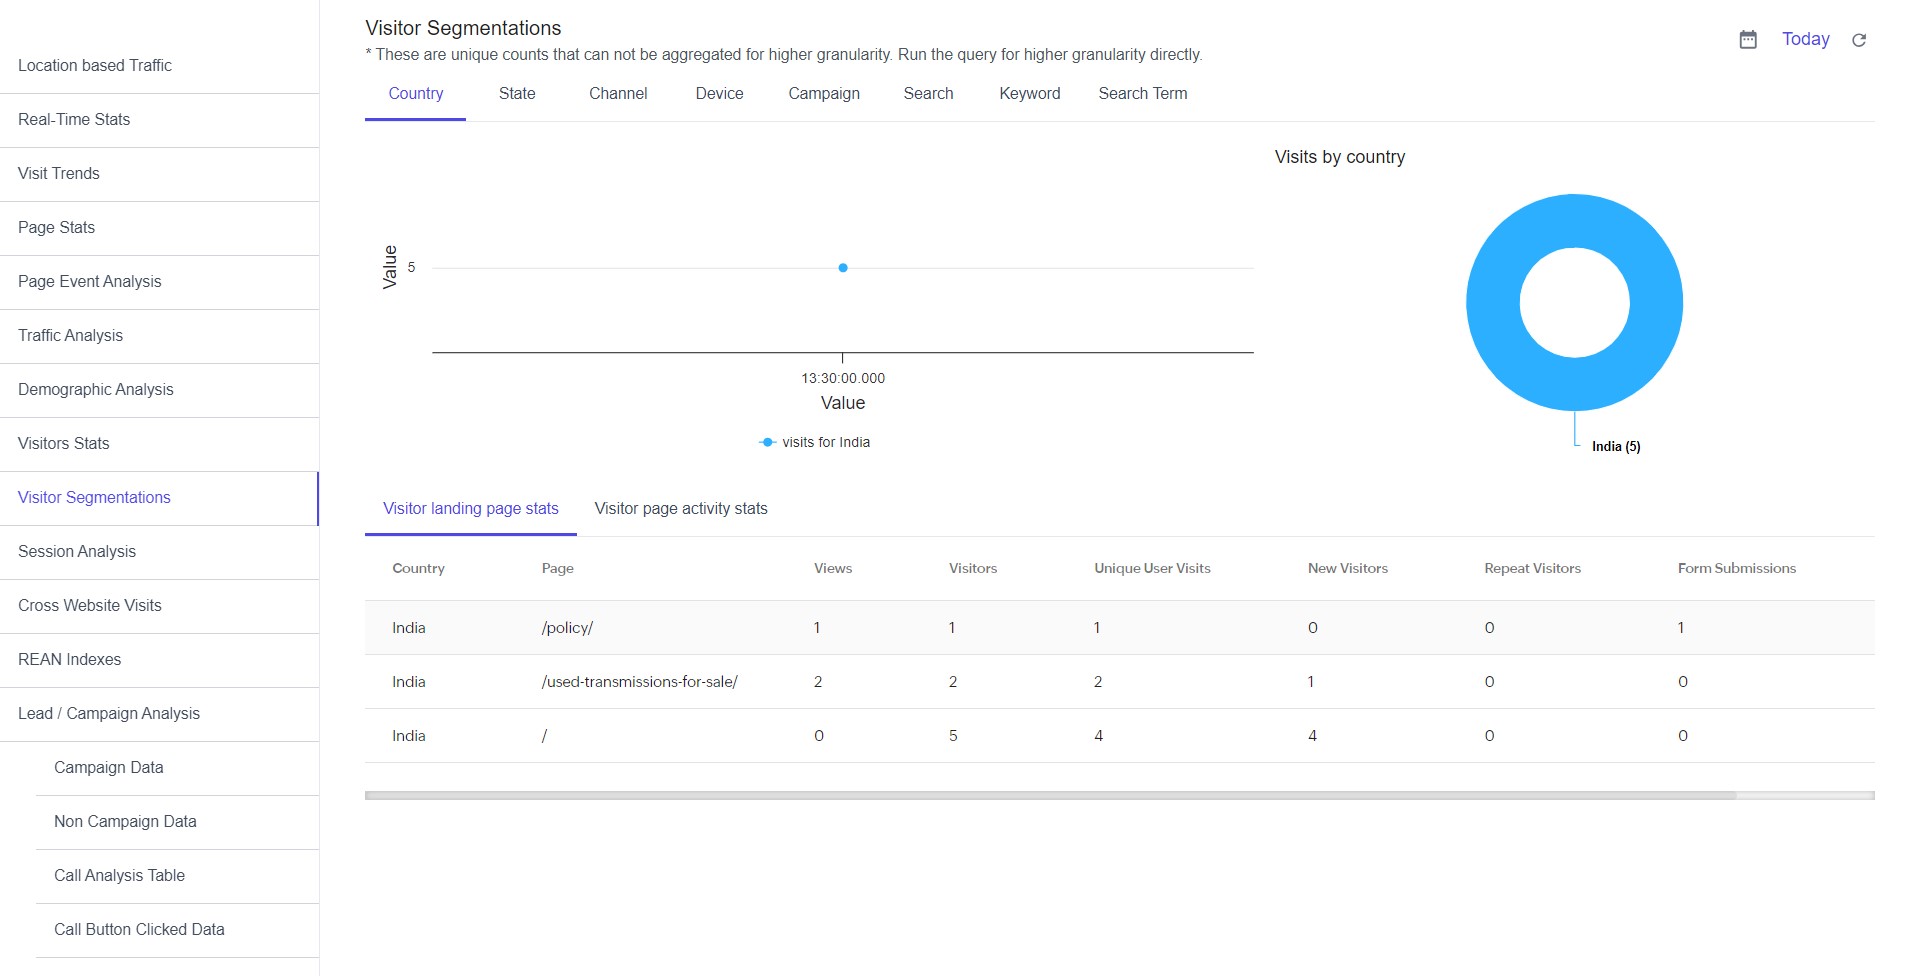
- Visitor Segmentations
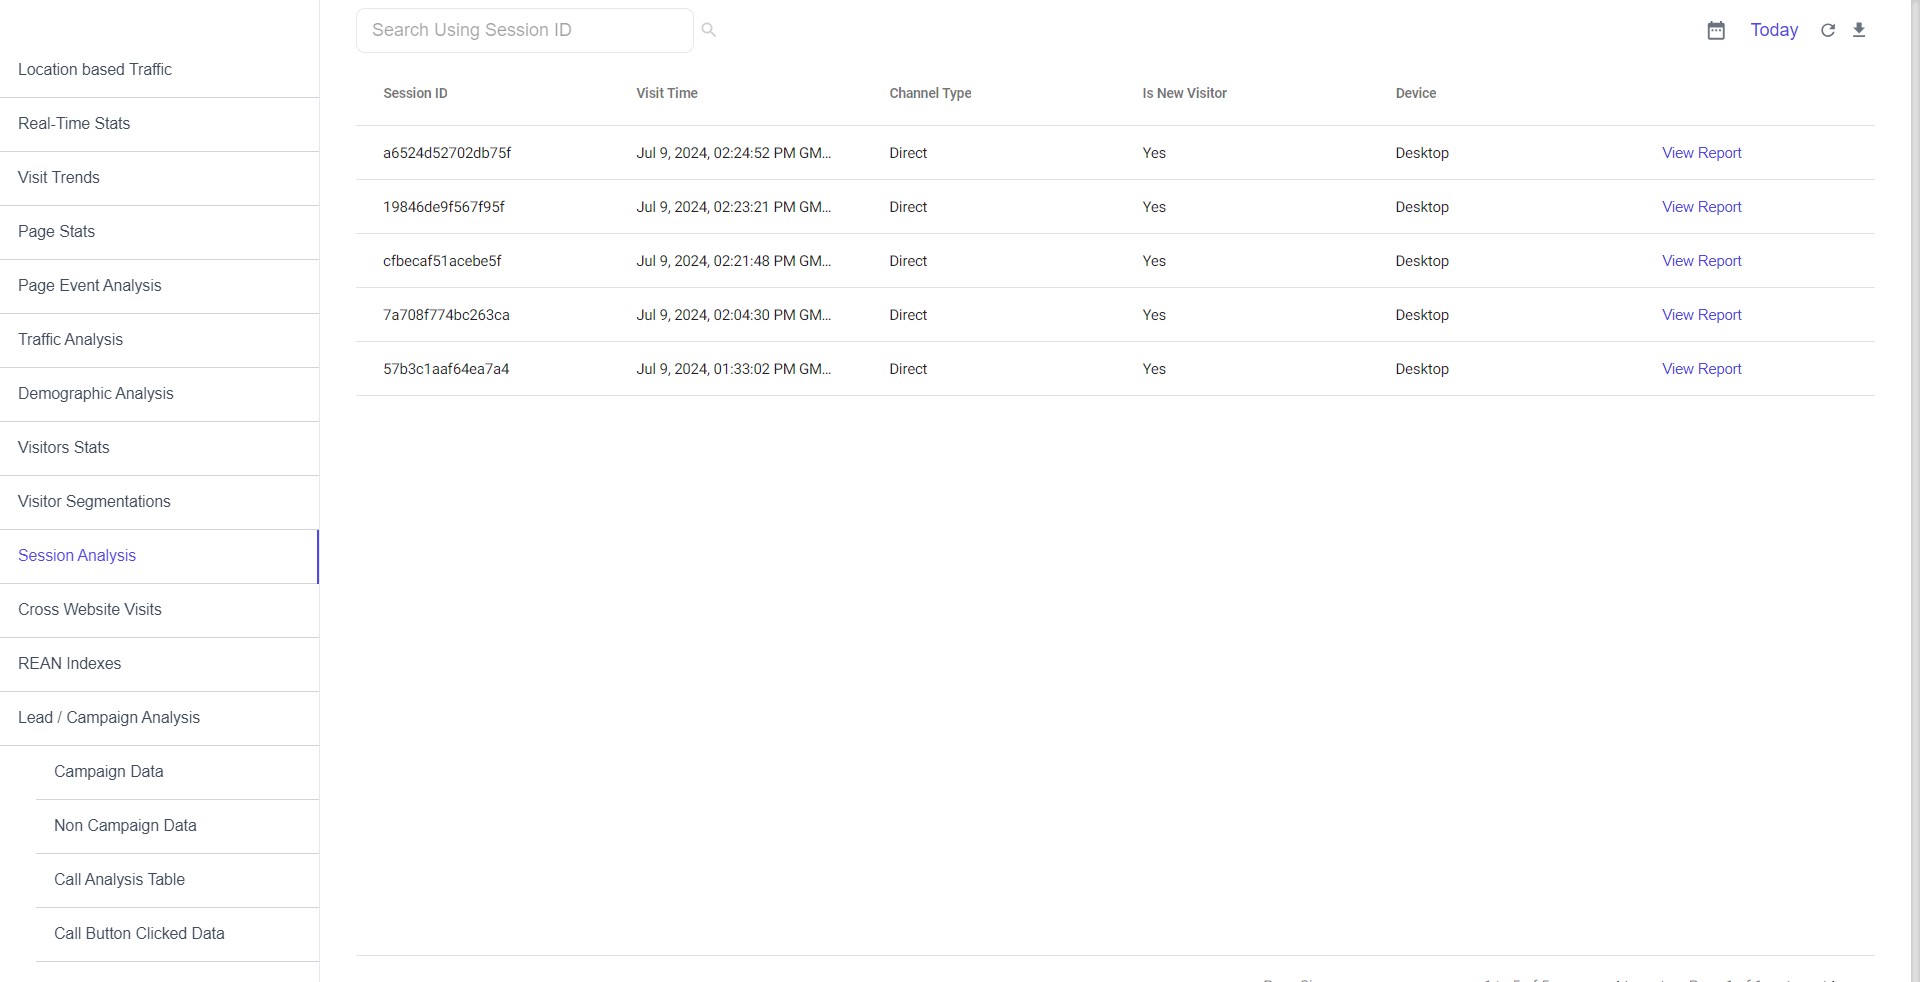
- Session Analysis
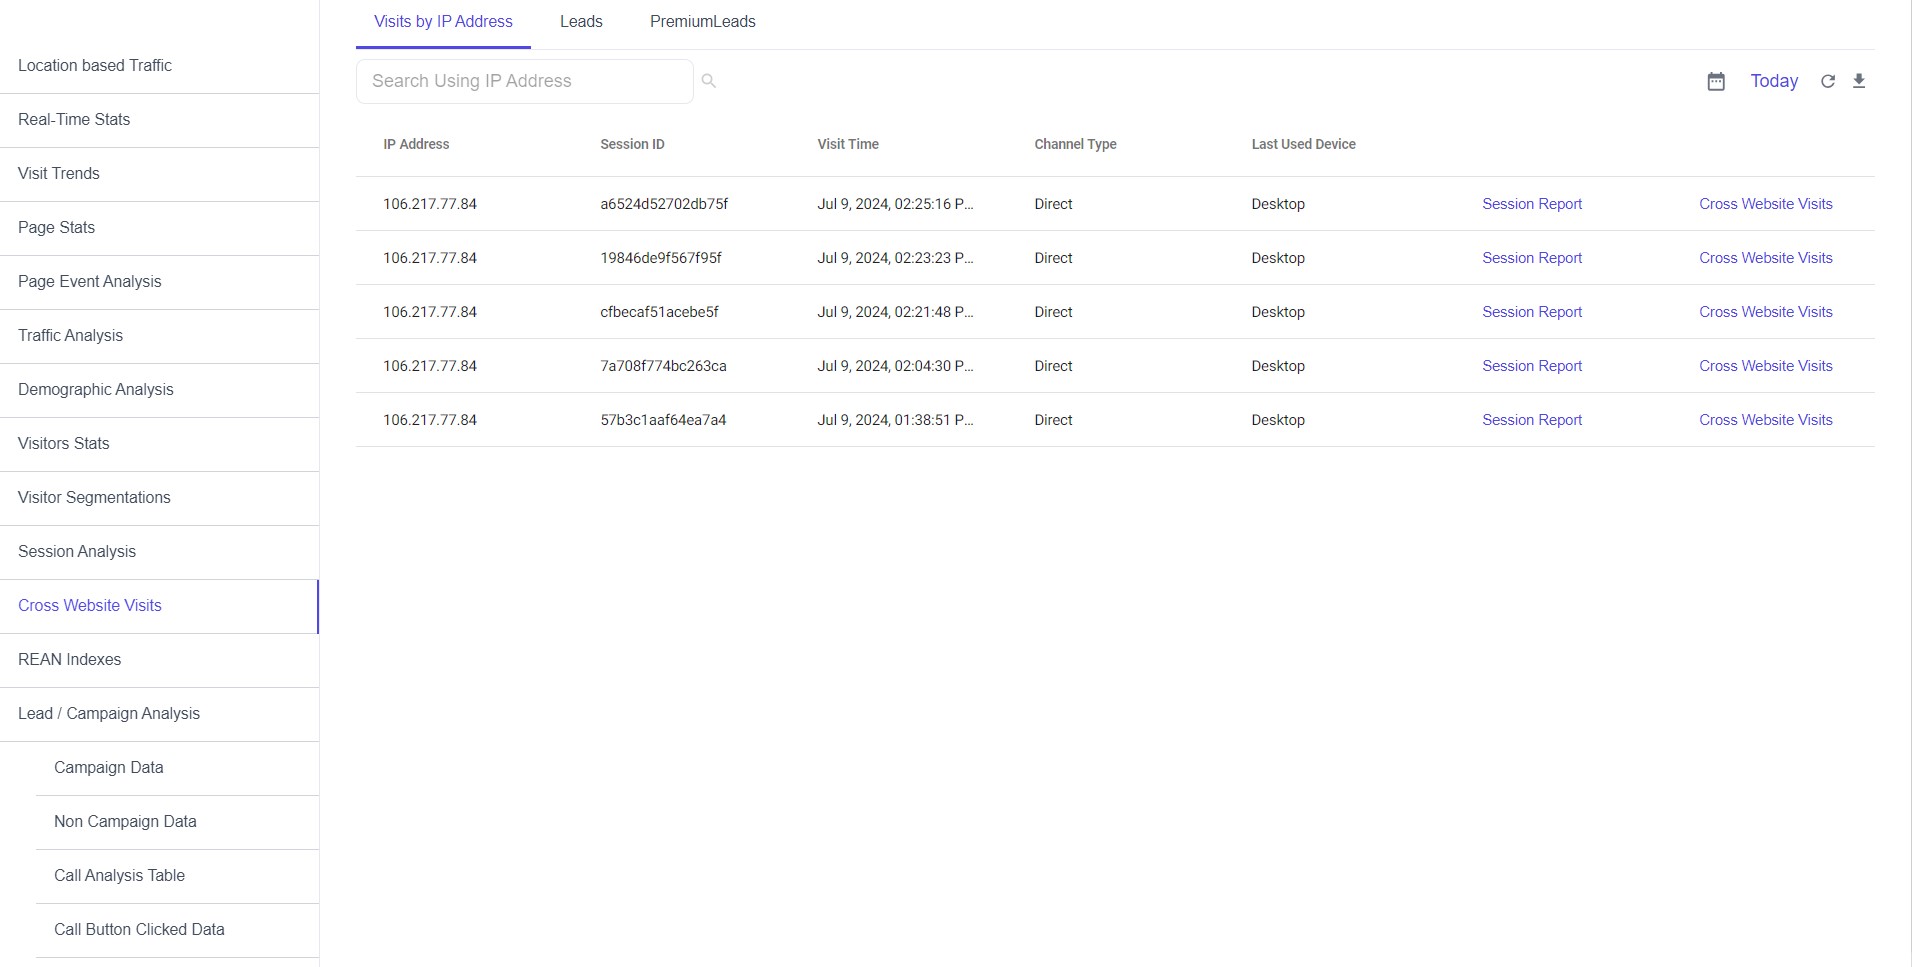
- Cross Website Visits
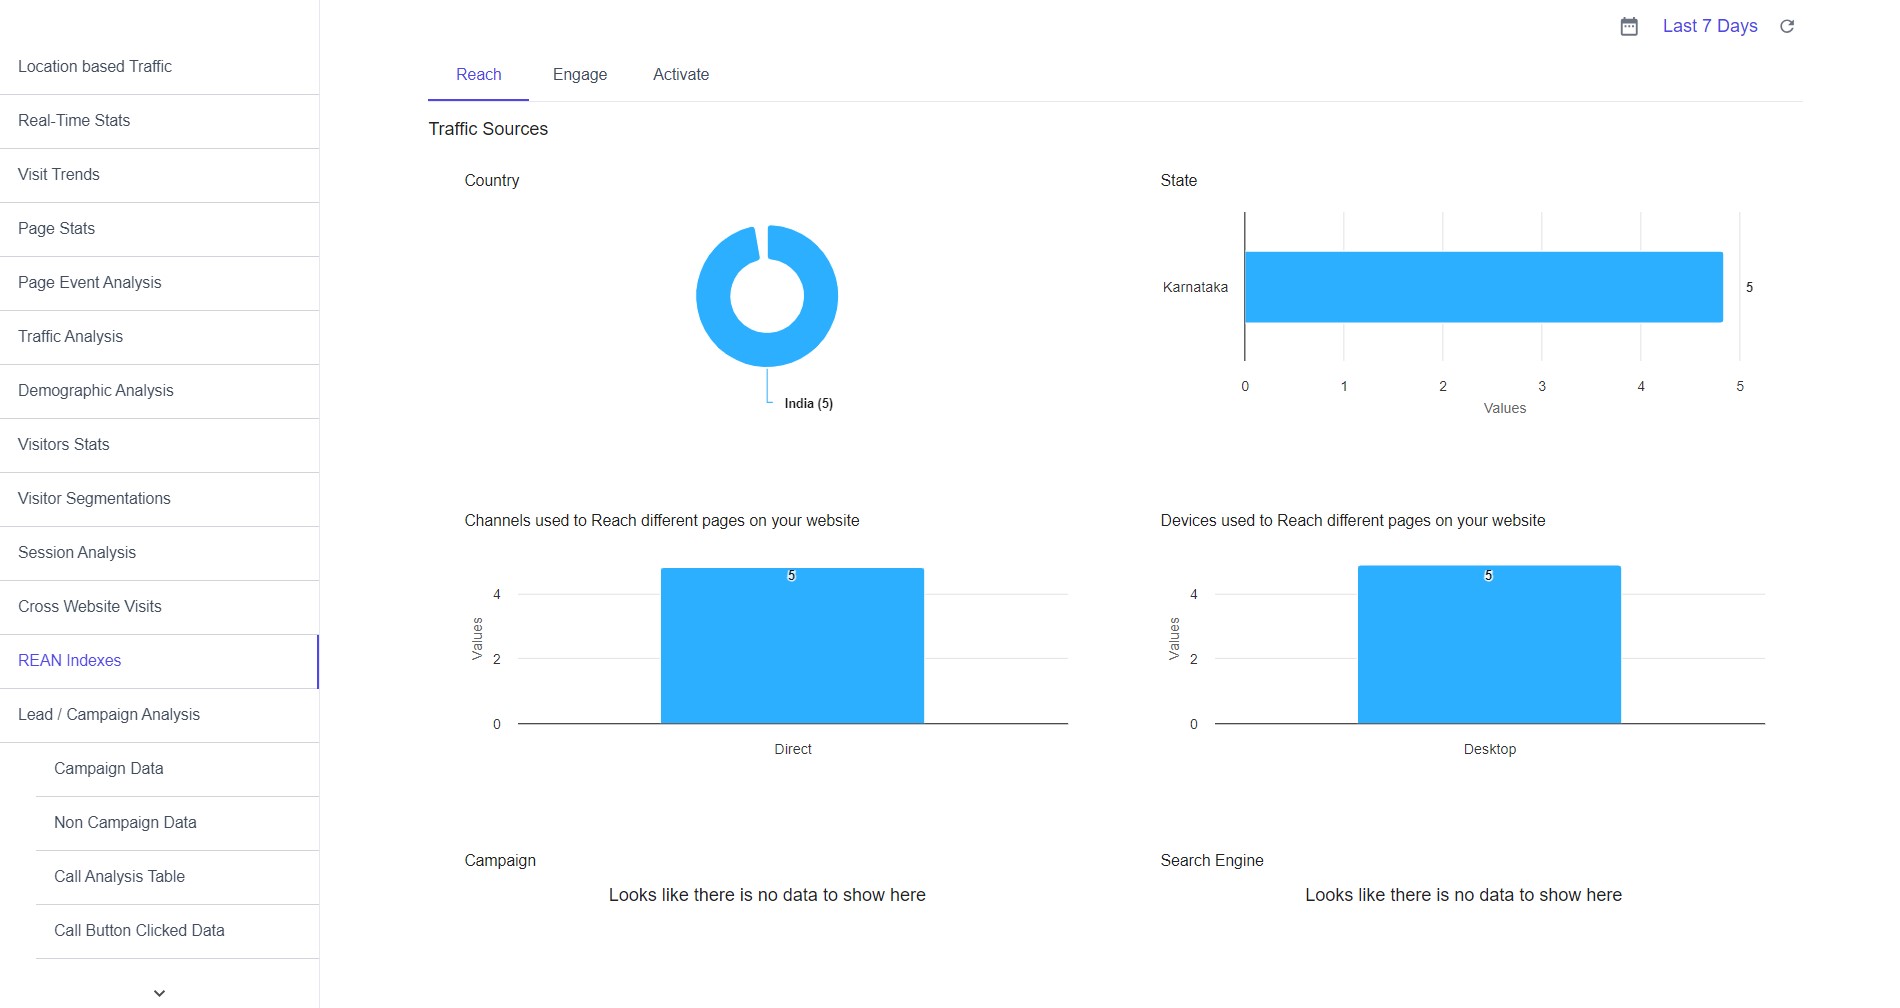
- REAN Indexes
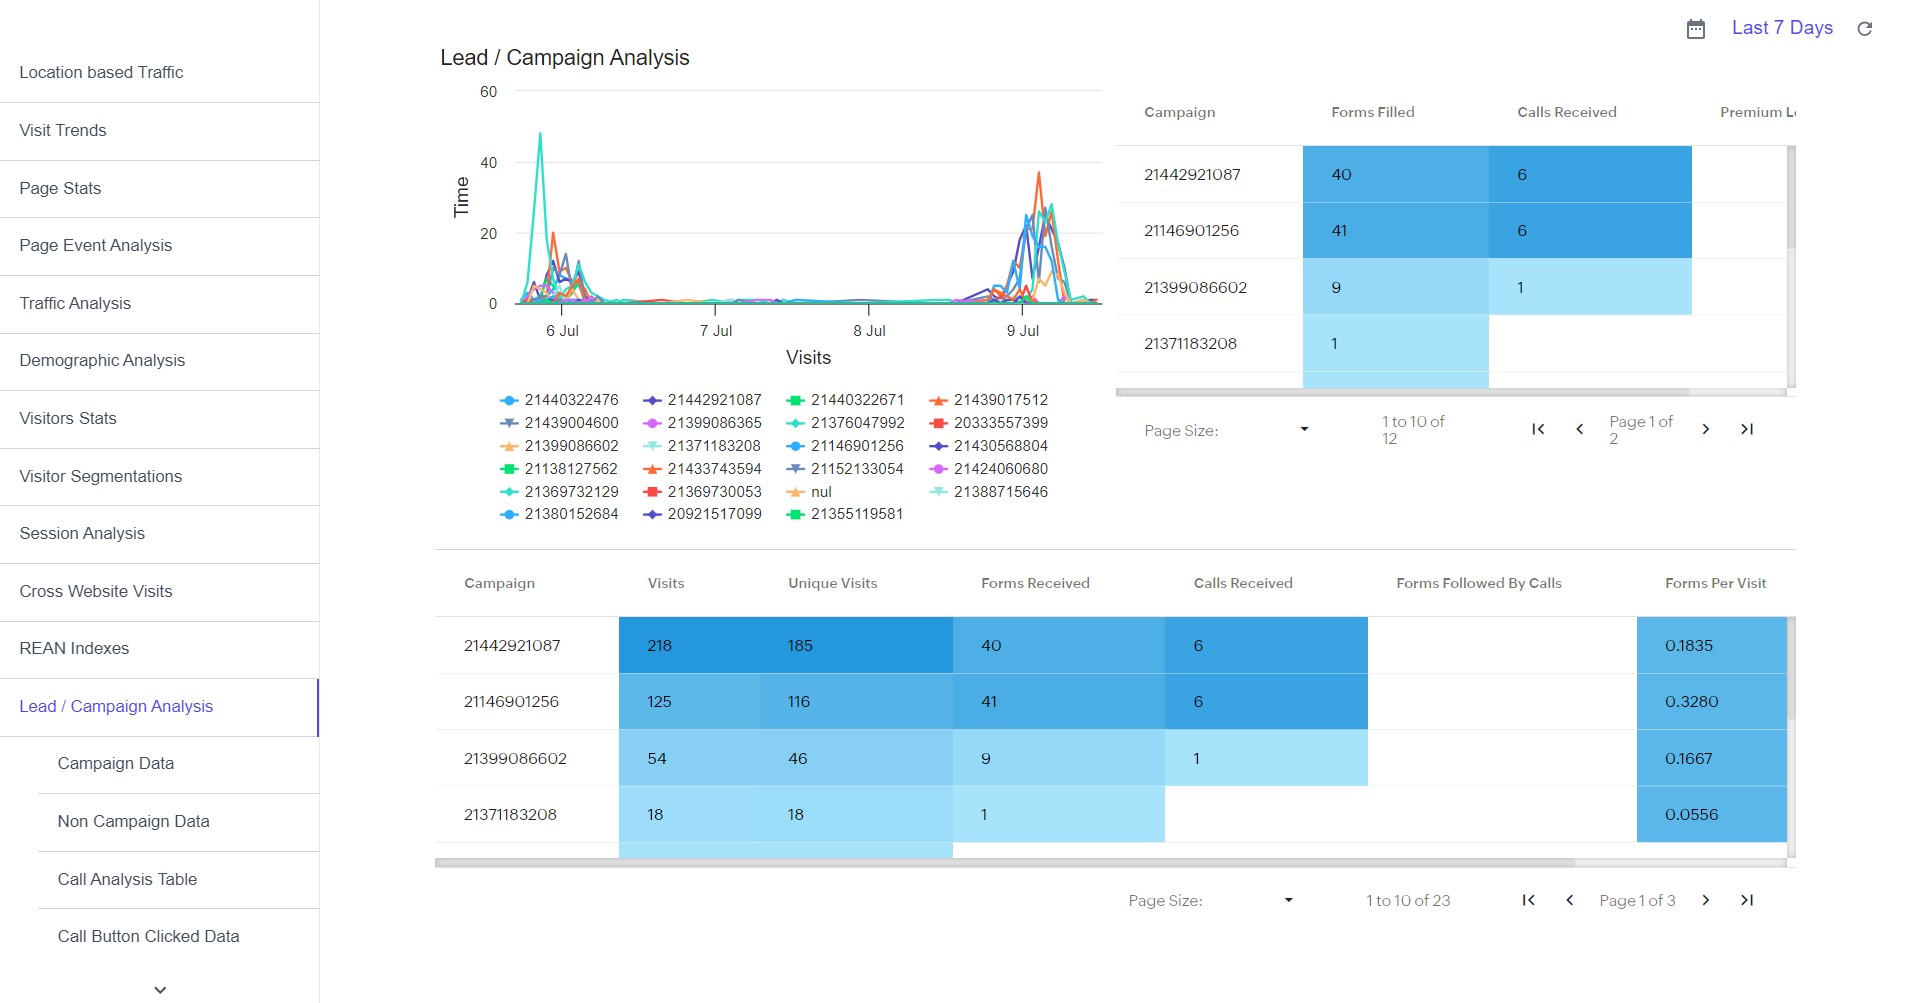
- Lead / Campaign Analysis
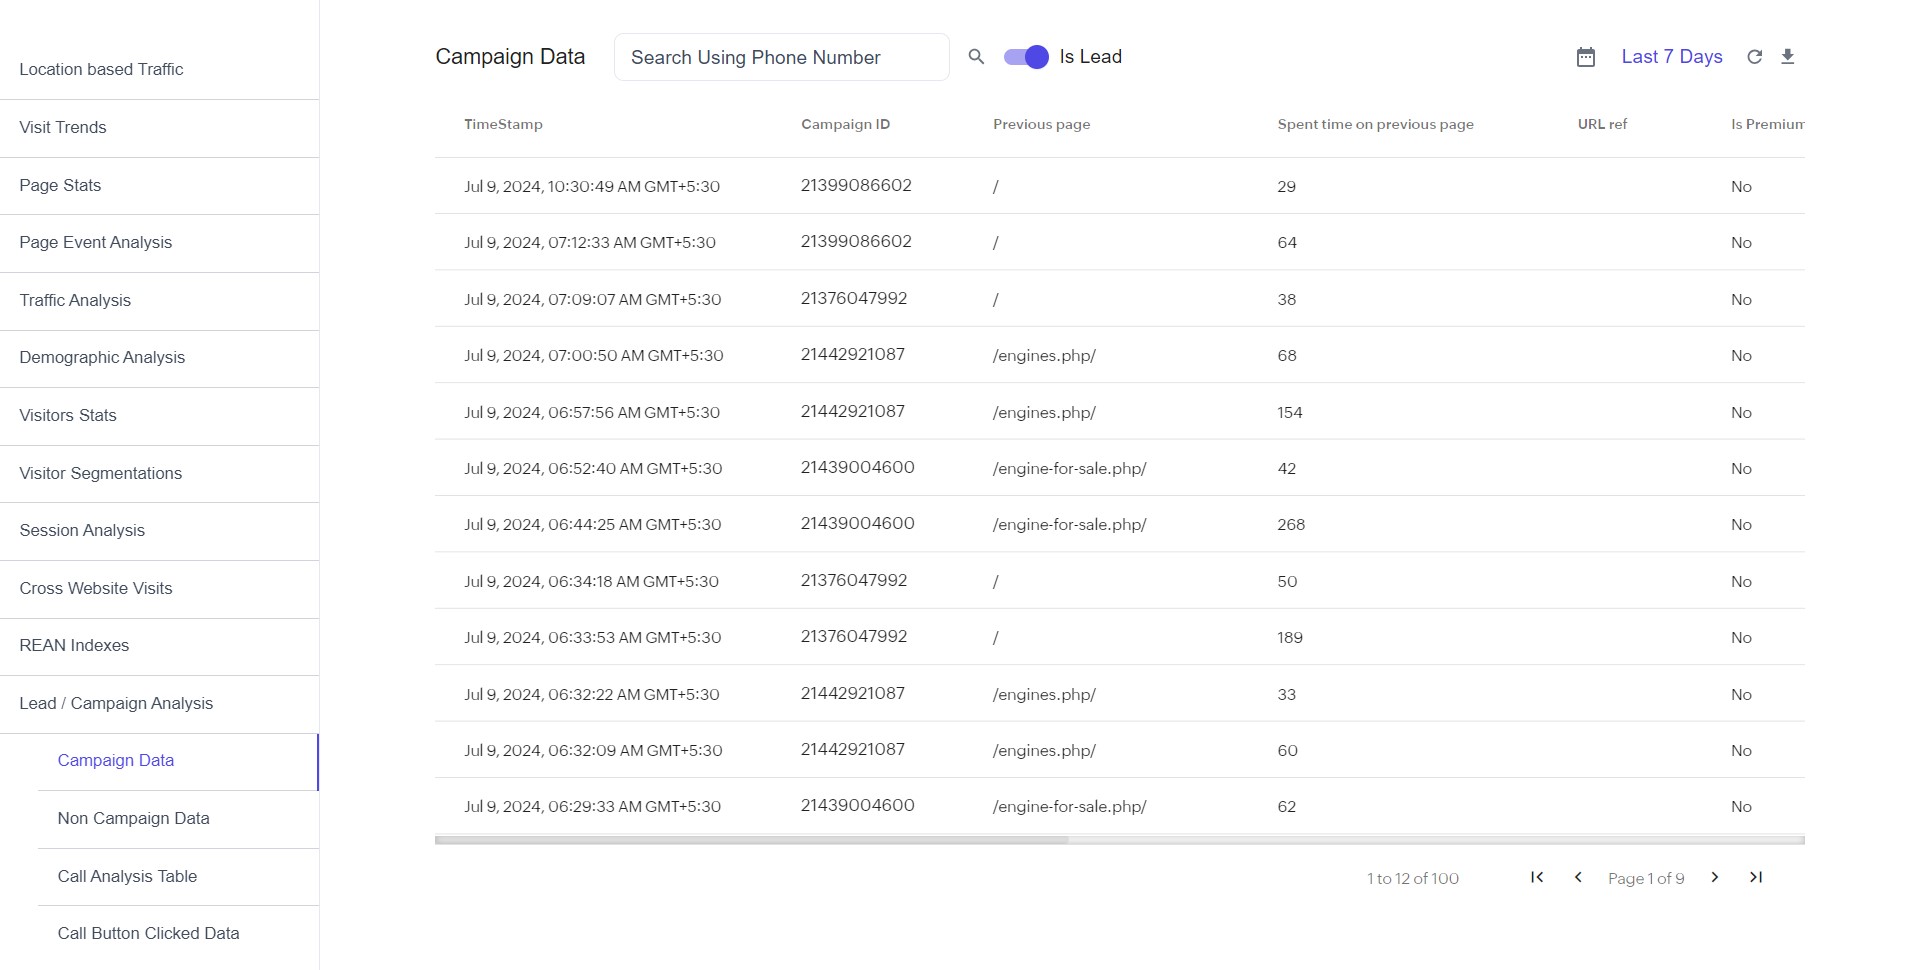
- Campaign Data
- Non Campaign Data
- Call Analysis Table
- Call Button Clicked Data
- Form-field lead stats
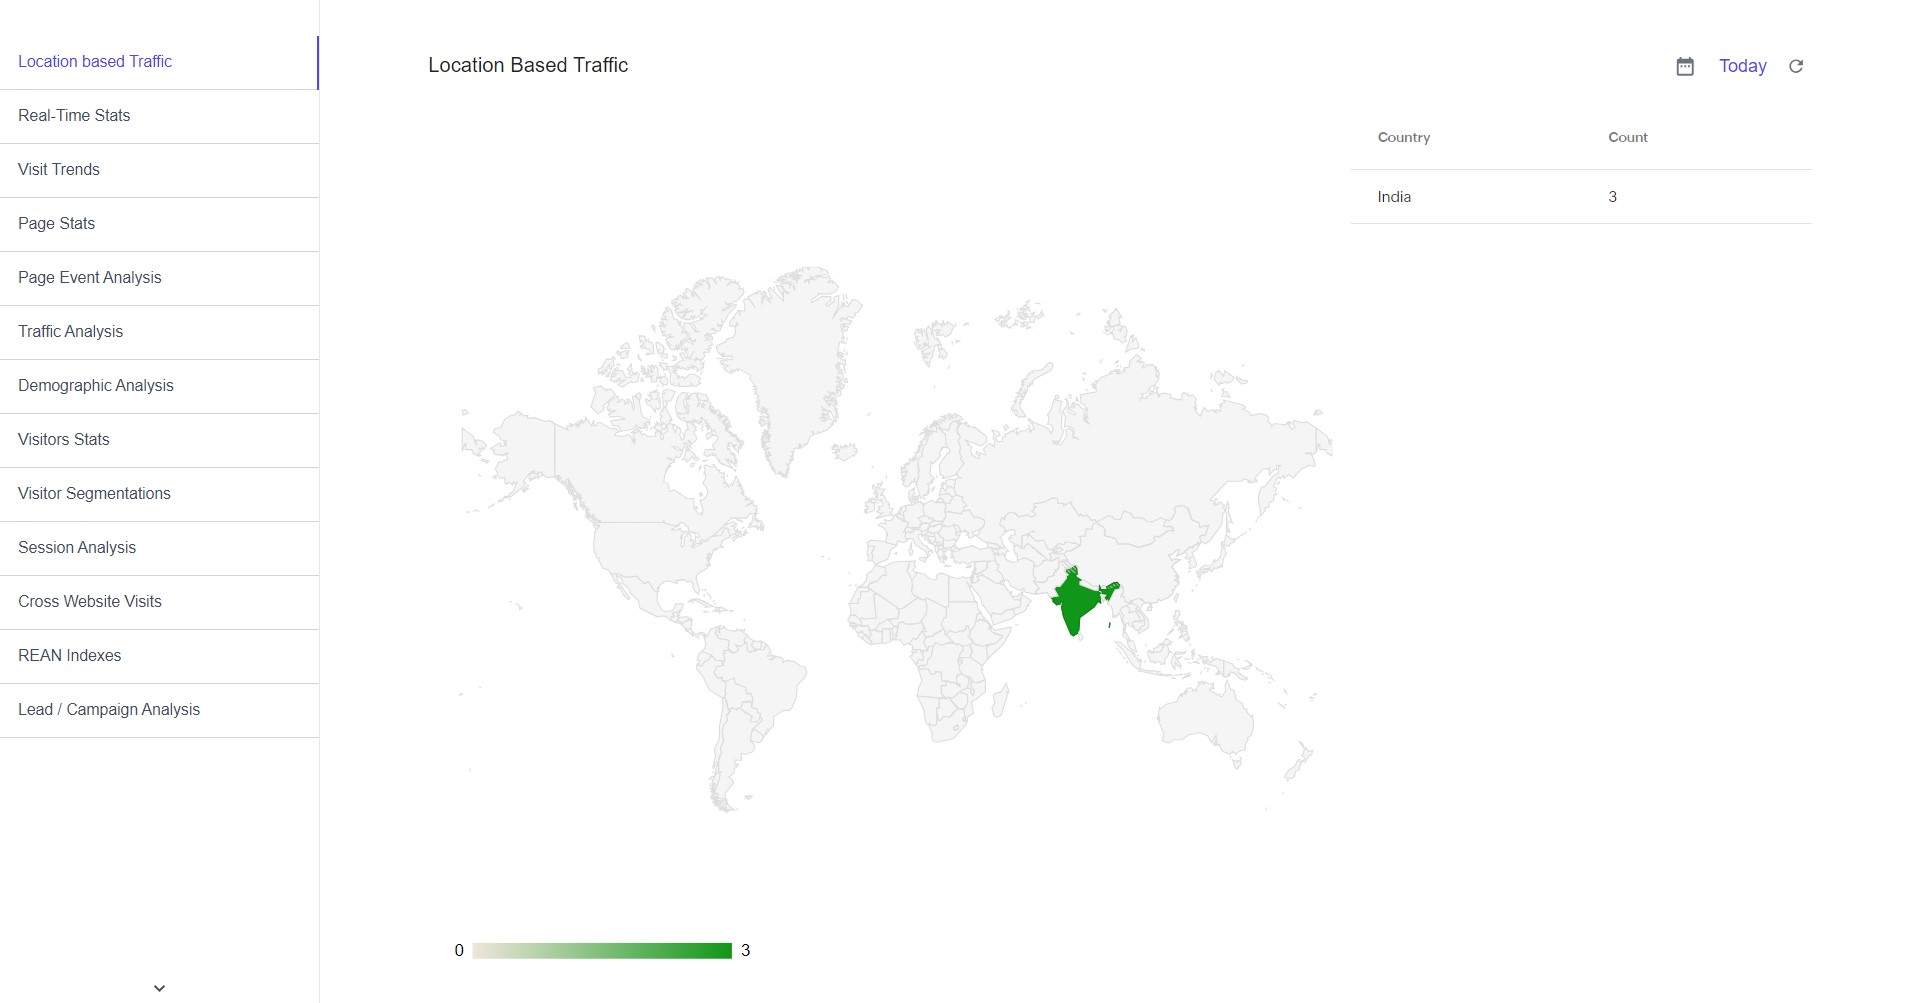
Location based Traffic
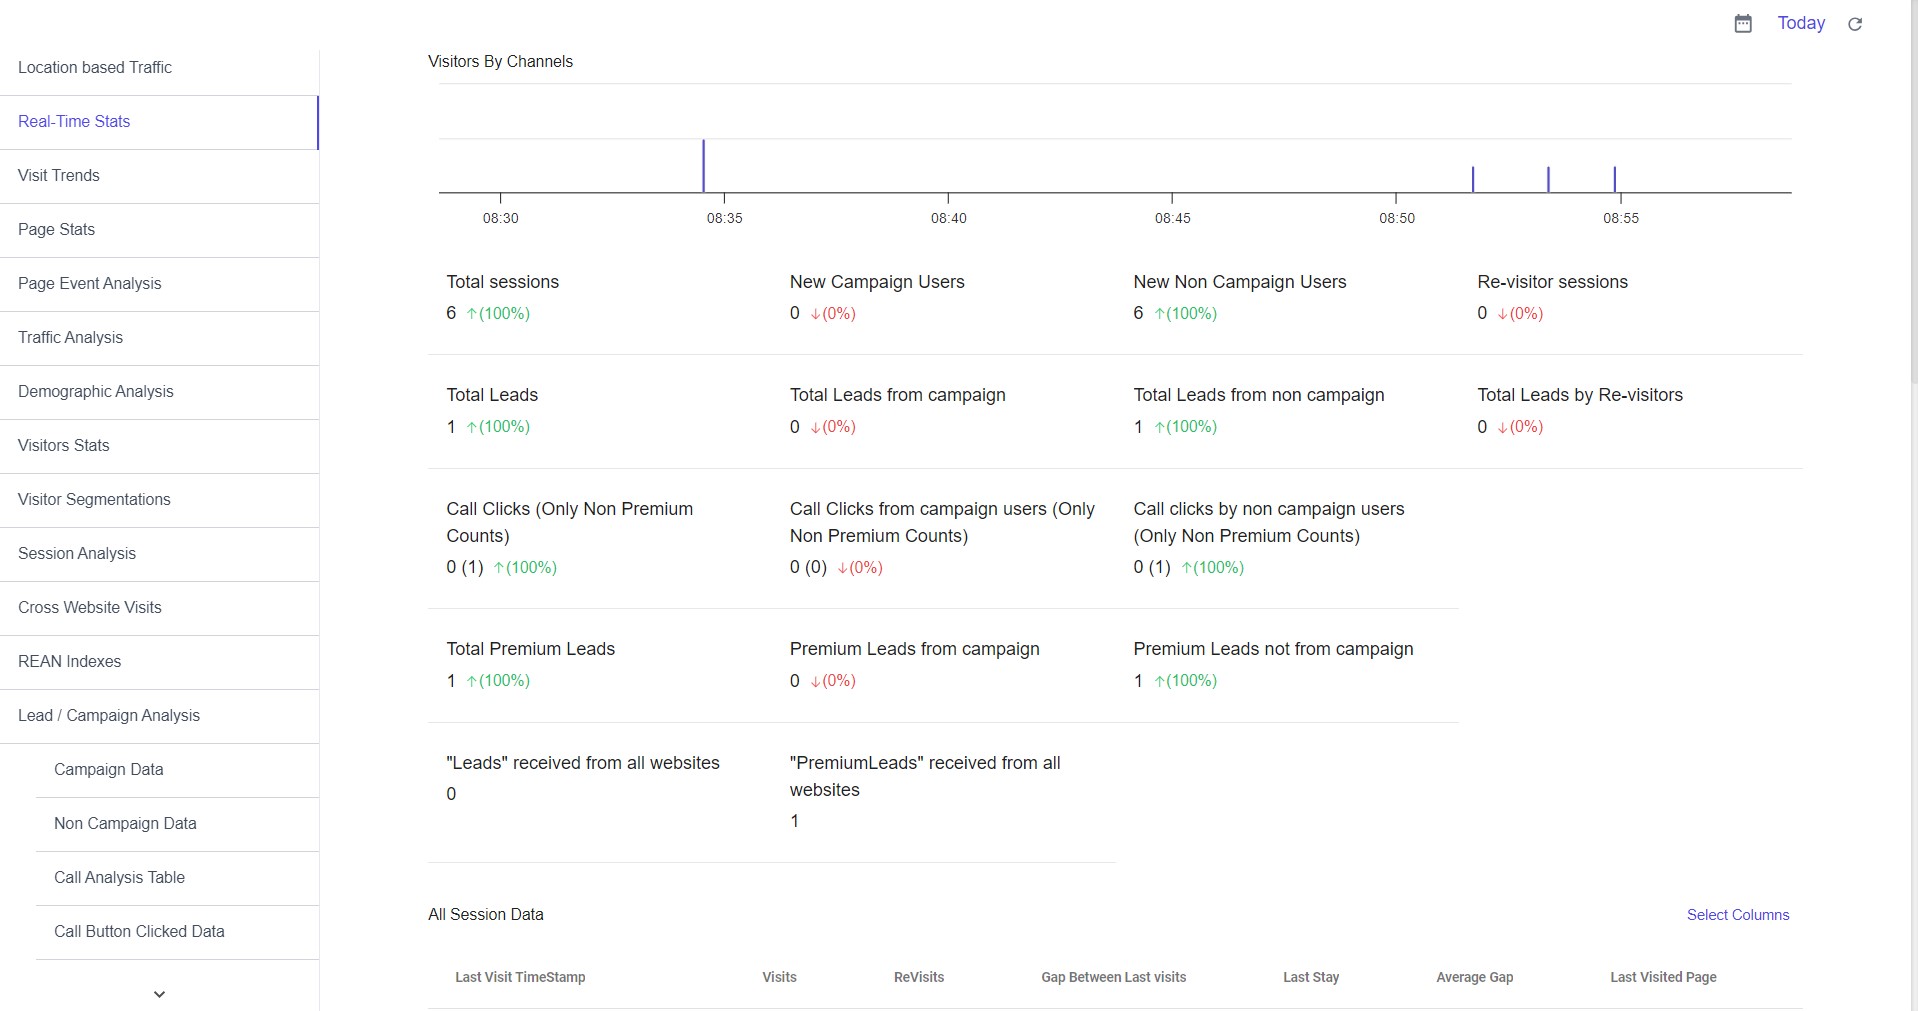
Real-Time Stats
Visit Trends
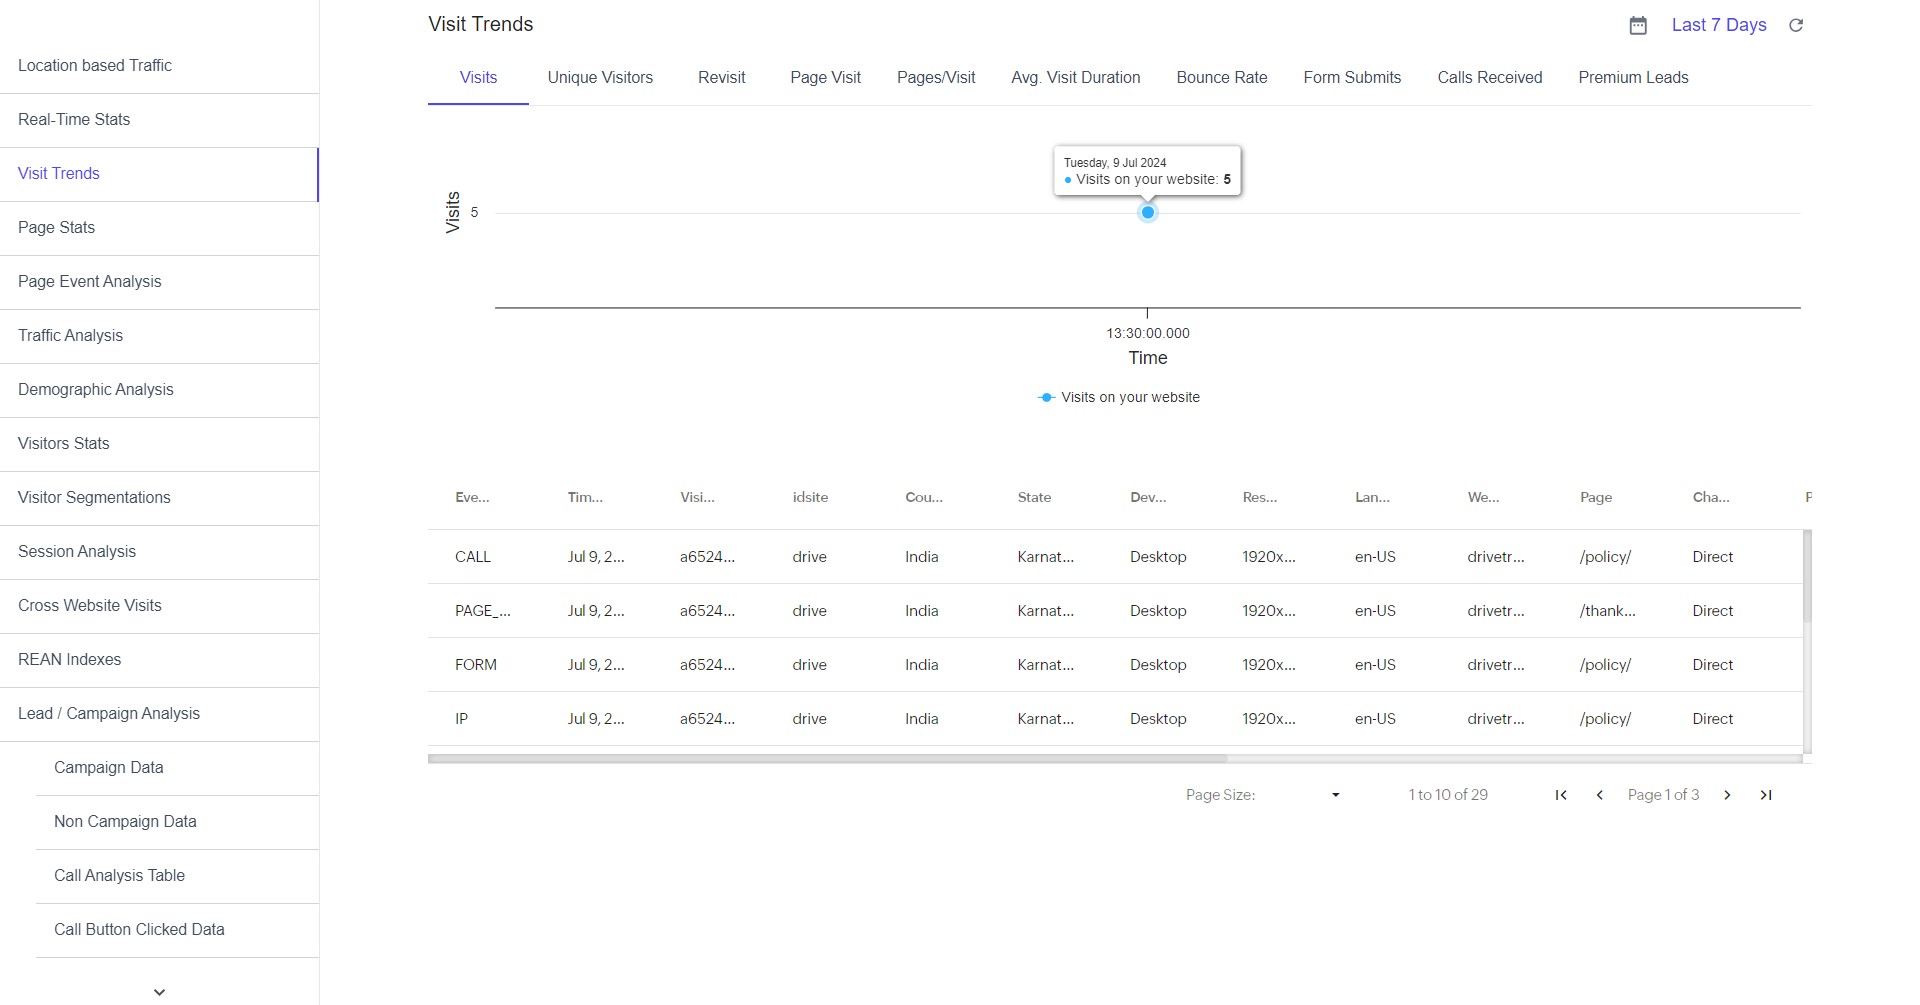
Page Stats
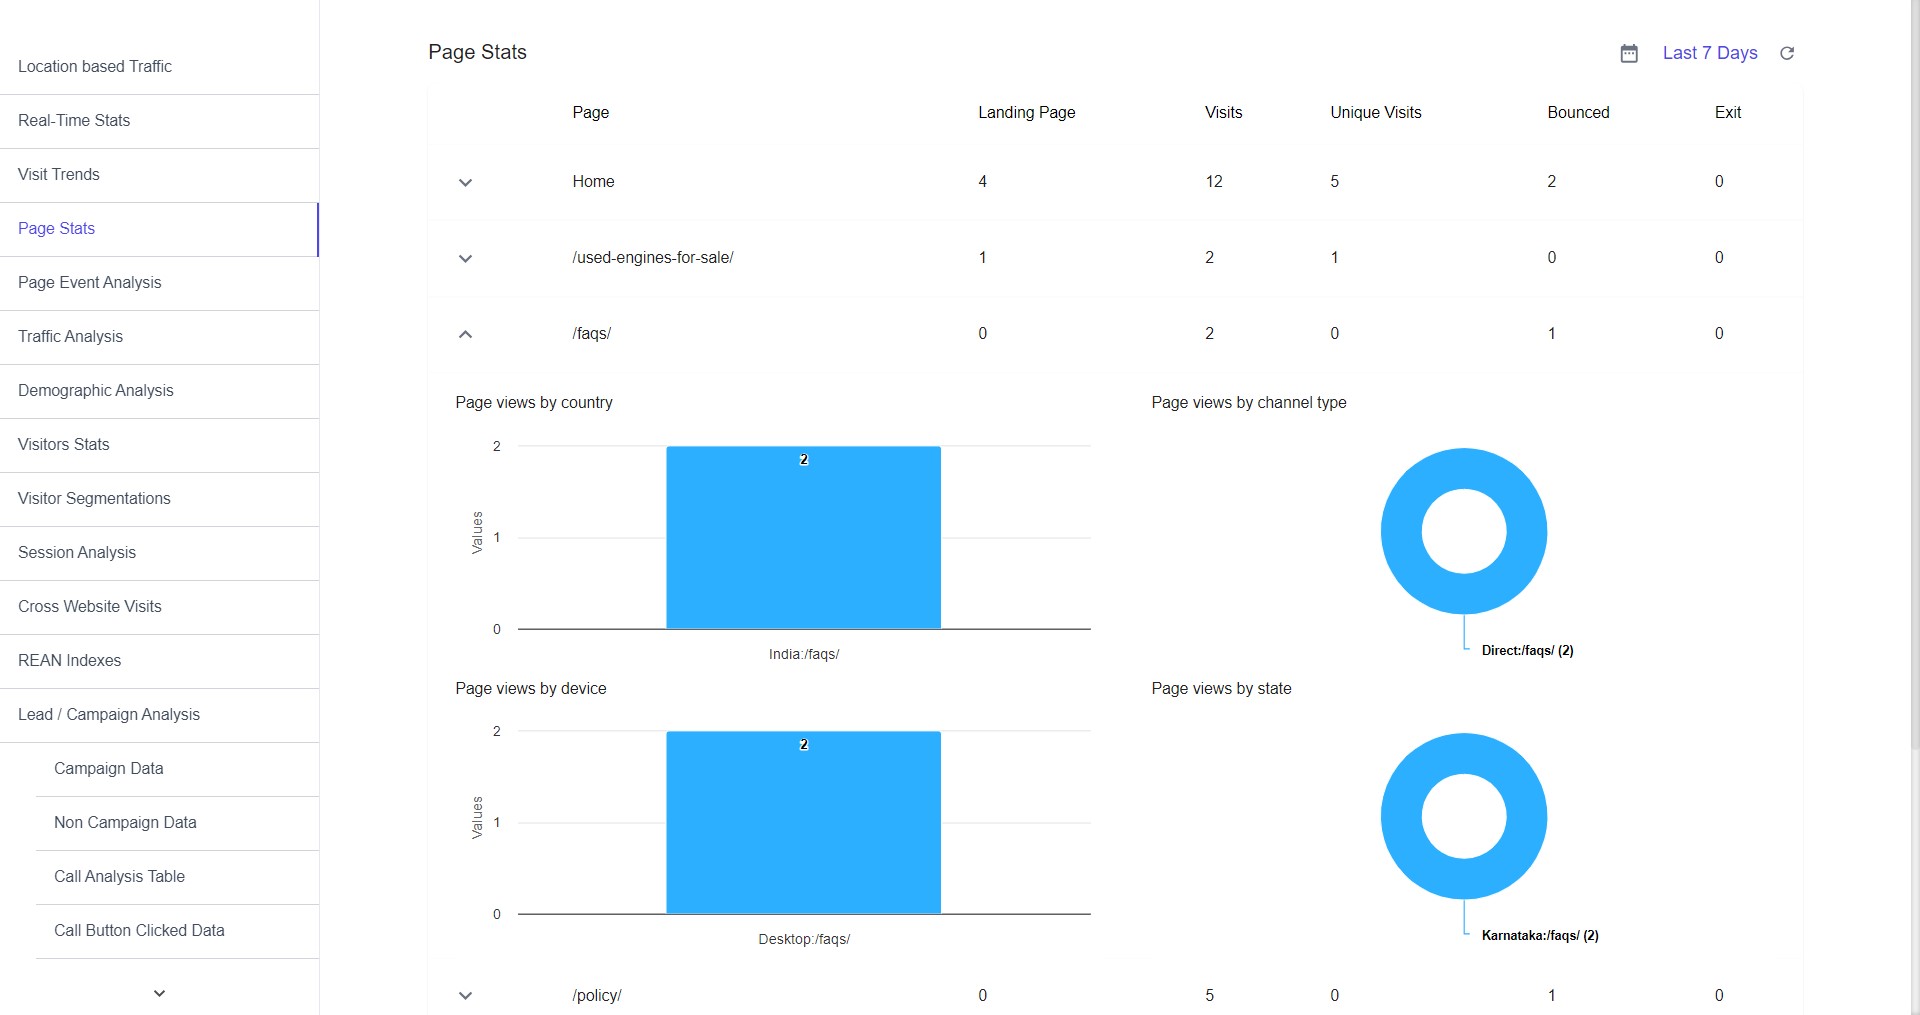
Page Event Analysis
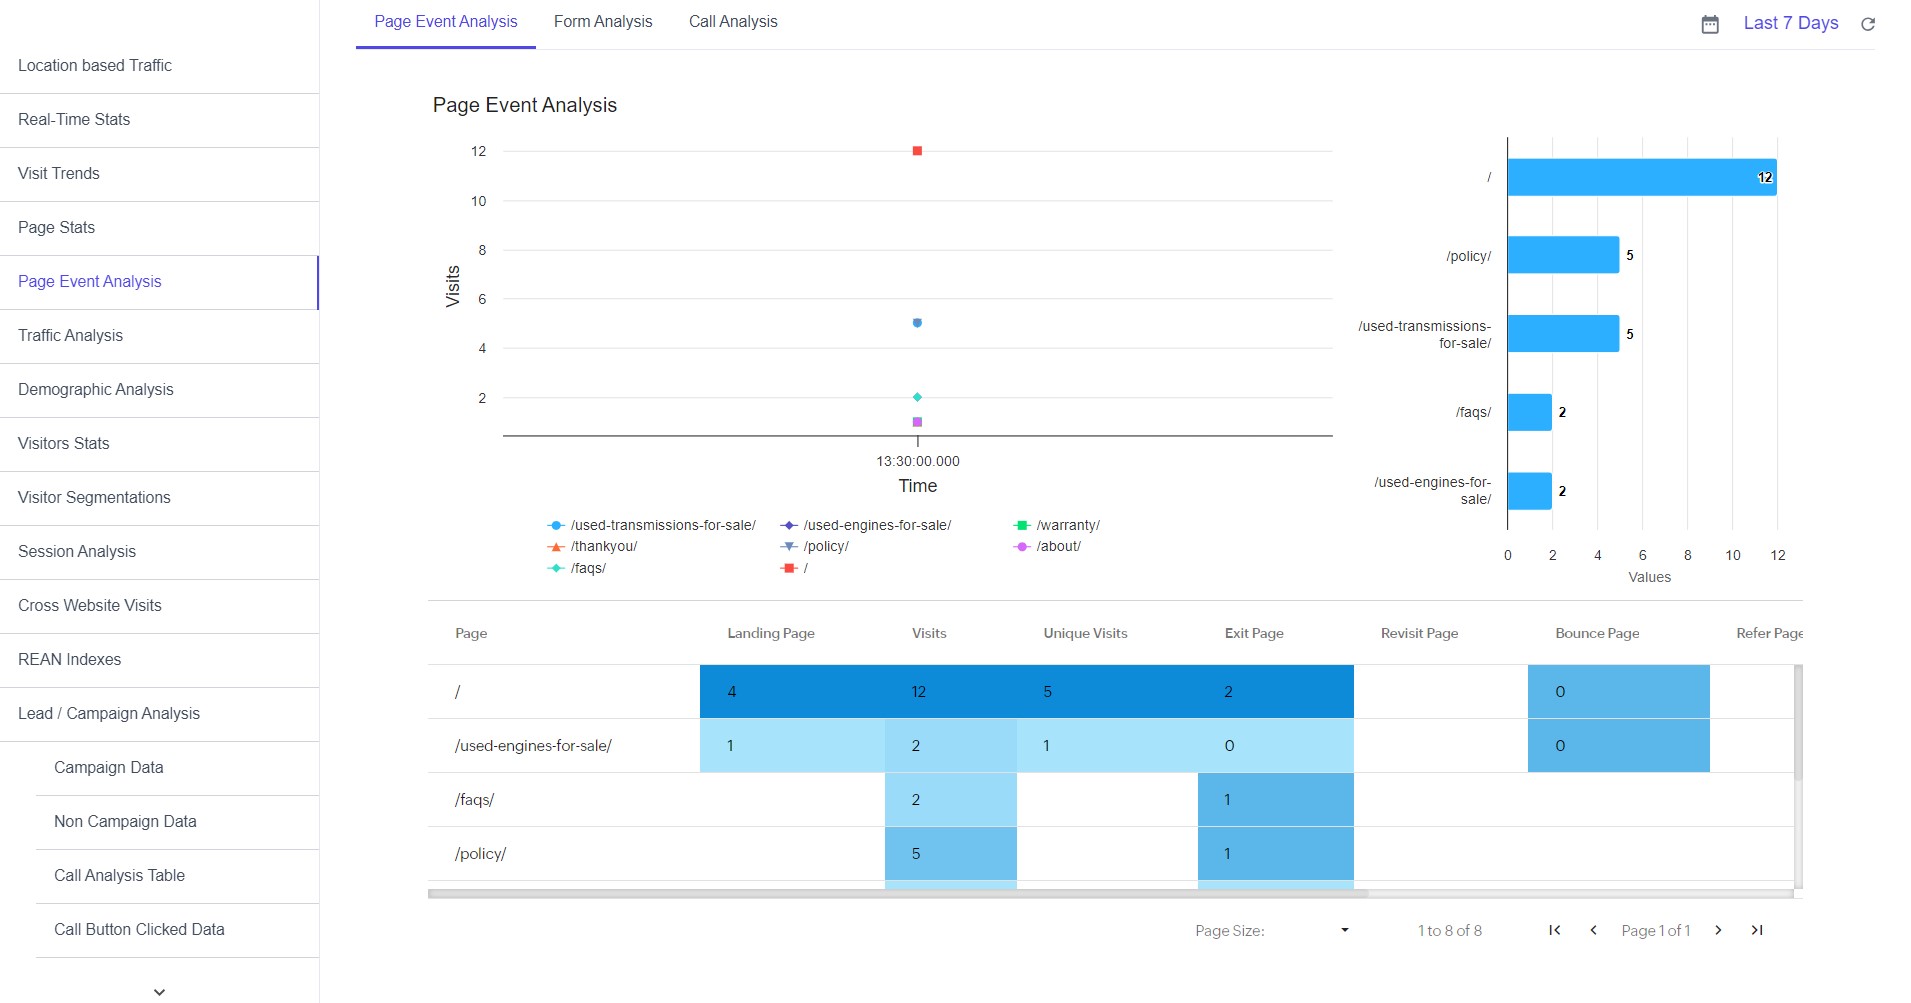
Traffic Analysis
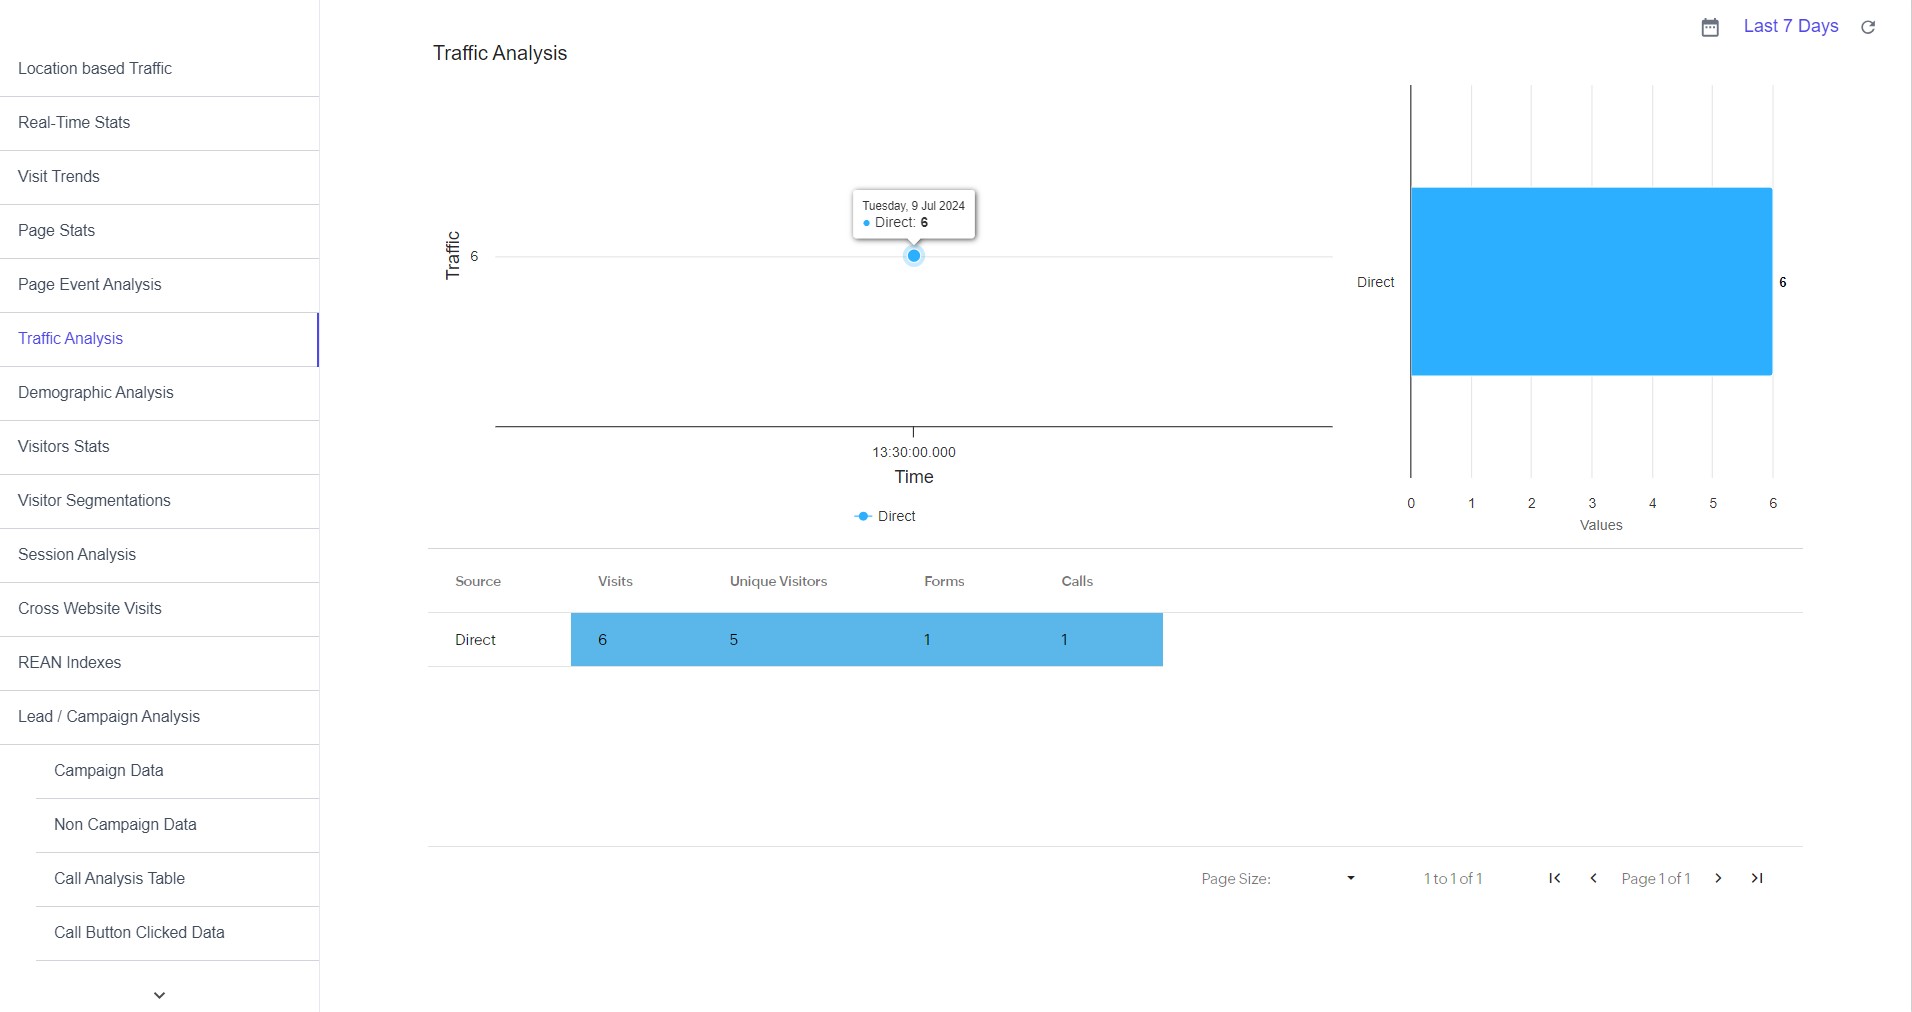
Demographic Analysis
Visitor Stats
Visitor Segmentations
Session Analysis
Cross Website Visits
REAN Indexes
Lead / Campaign Analysis
Campaign Data
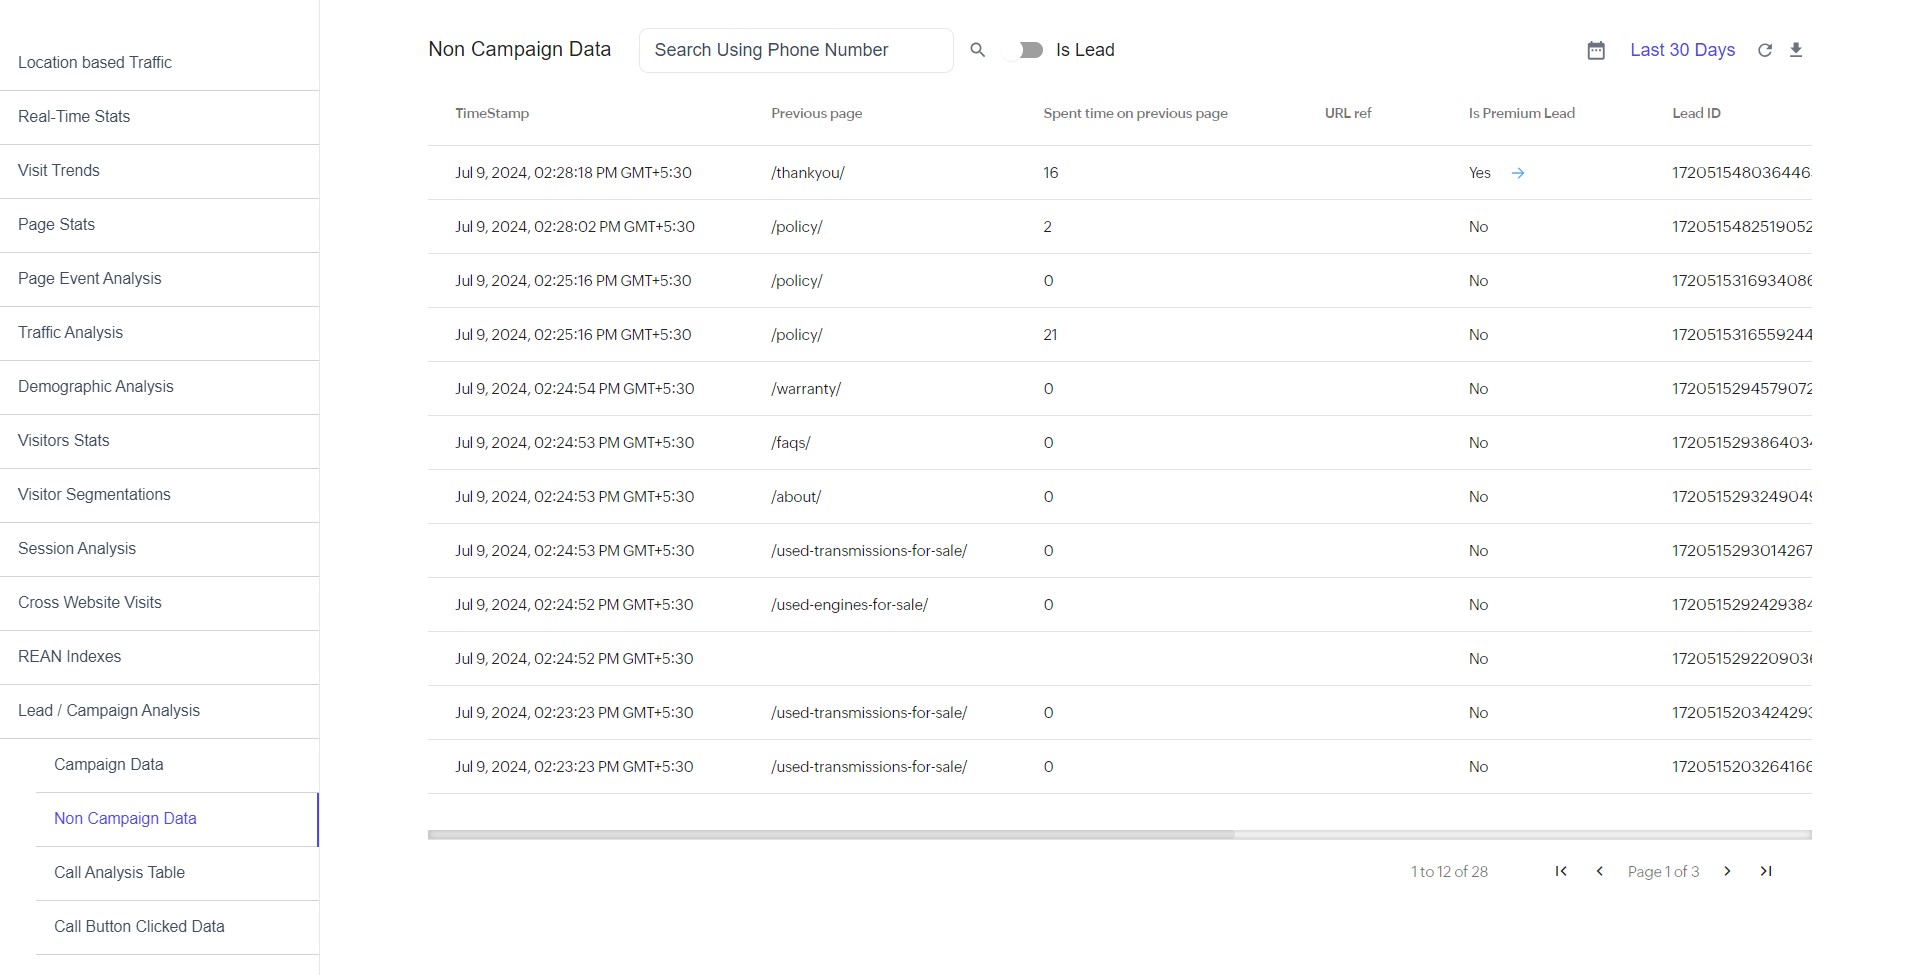
Non Campaign Data
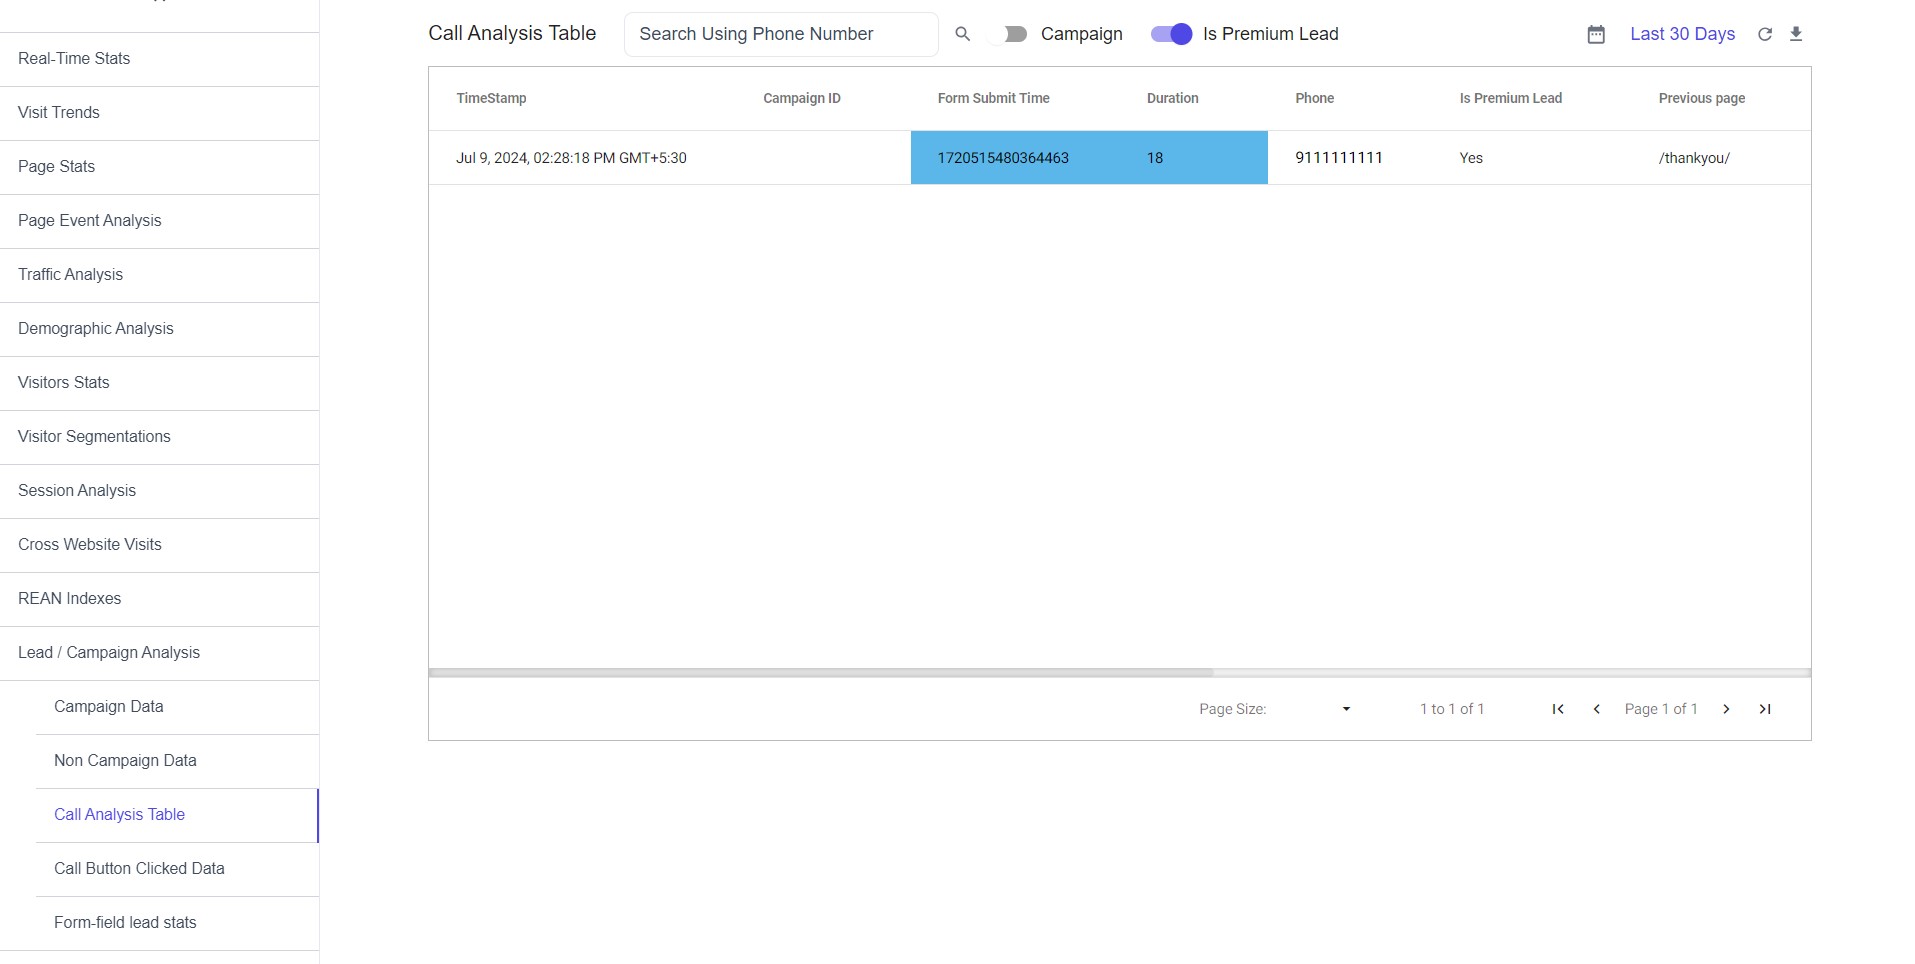
Call Analysis Table
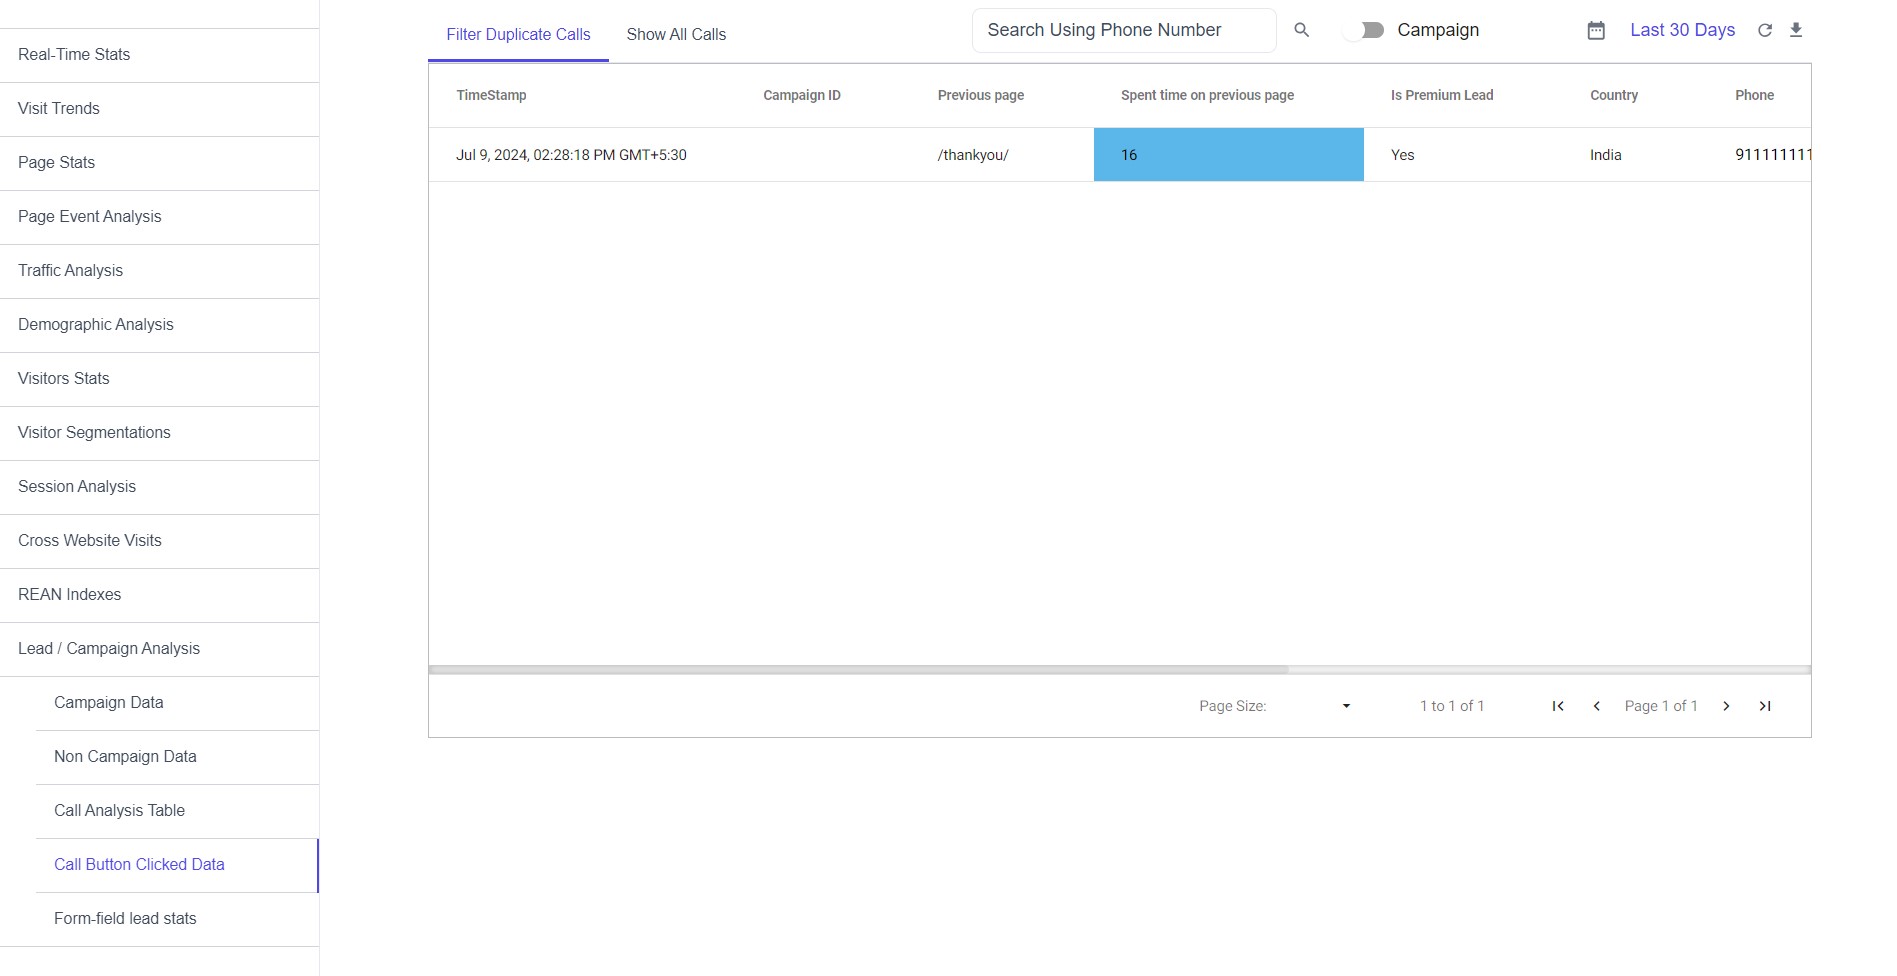
Call Button Clicked Data
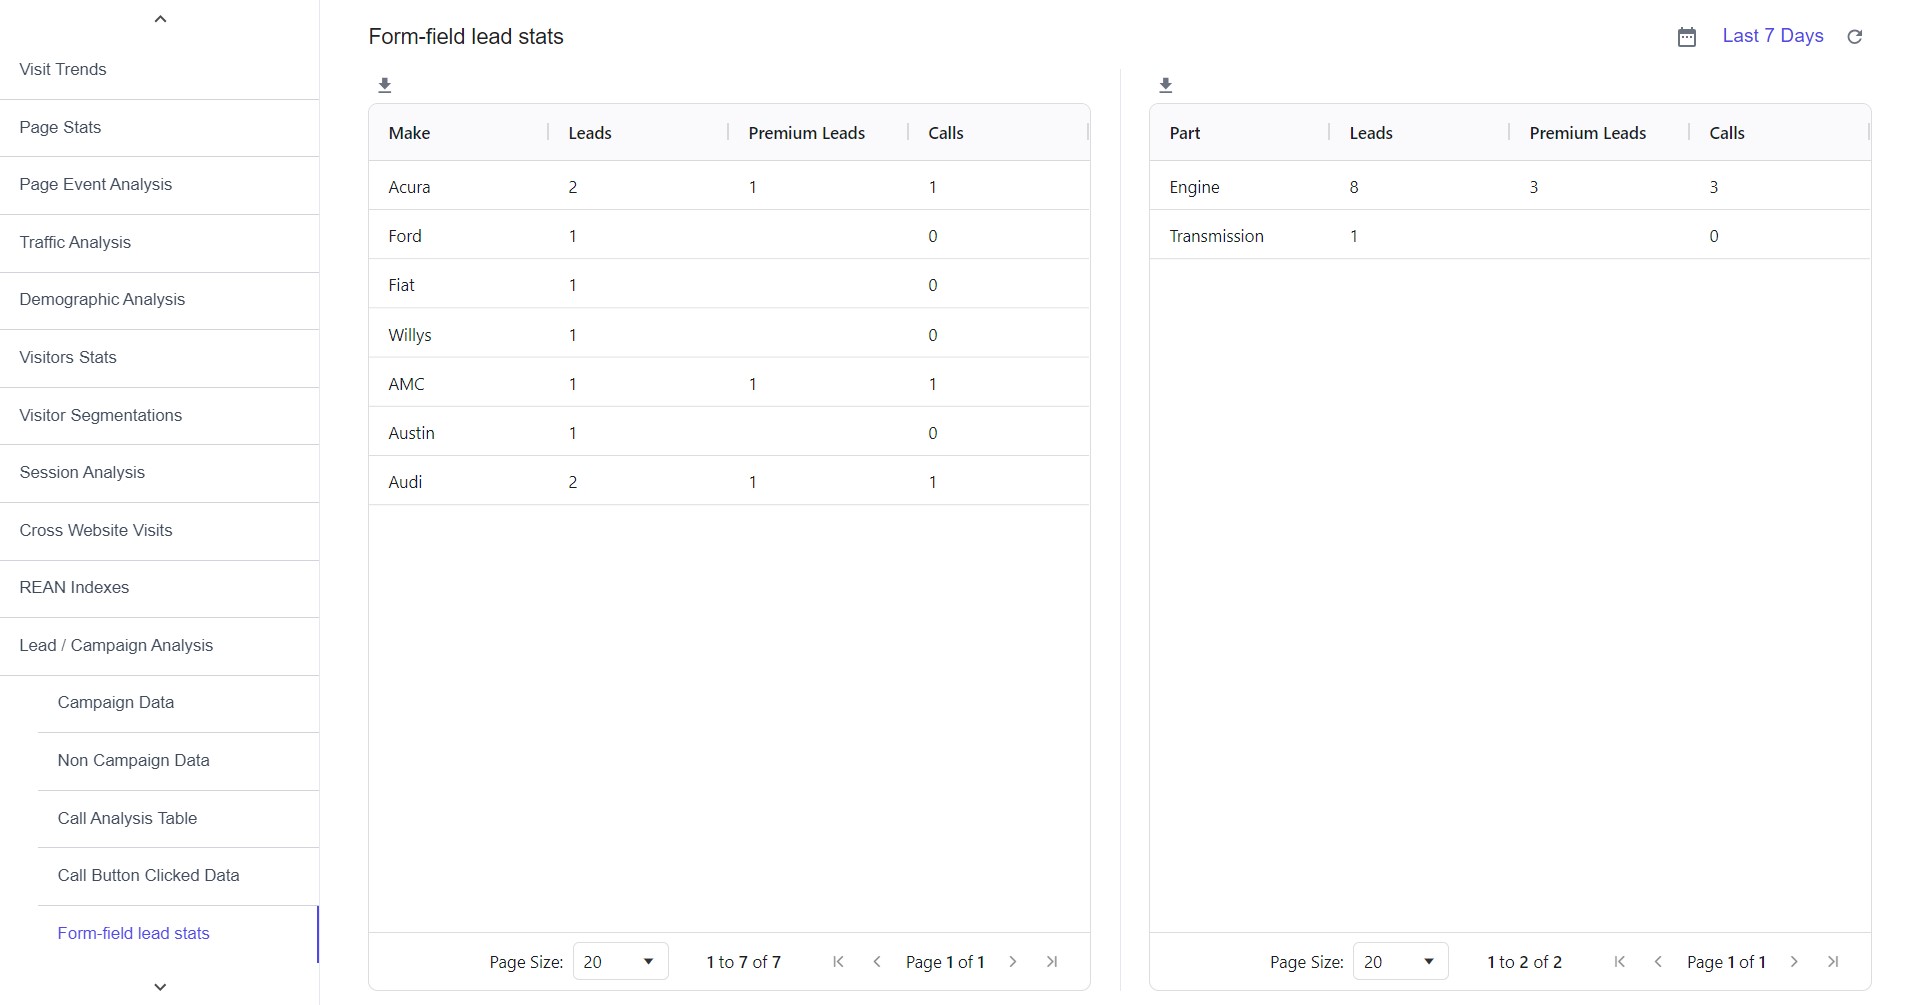
Form-field lead stats
