BangDB Benchmark for Streamoid
Introduction
The benchmark is specific to the use case of the Streamoid’s product Catalogix on MongoDB. The Catalogix is a platform for managing ecommerce product catalog for several stores, marketplaces etc. for world’s best retailers providing them with AI automations built for retail.
As part of POC, BangDB has been deployed to bring in the convergence of various elements for more efficient storage of data and processing. The major goals for the POC are to assess the improvement in performance vis-à-vis current implementations and reduction in operational (both dev and management) overhead. To achieve this BangDB has implemented a Schema which defines the logic for ingestion of events/data, processing of various elements, some running stats, ETL etc. as part of the stream processing. Further it also defines the logic for auto-updating the underlying graph to maintain the sub-pred-obj triple to allow query to leverage the natural relationships for query and avoid the run time joins etc. There are many other aspects which we have not yet implemented and integrated namely ML of stream, pattern/anomaly detection, actions, etc. which could be later augmented as required.
Further, to evaluate this in an interactive manner, a test portal has been created on Ampere mimicking the UI flow of the Catalogix (from query perspective and not from look-n-feel)
Setup
Data
Streamoid: Around 25GB database on Prod on MongoDB, so we tried to use 3X overall of this size on BangDB
1. BangDB:Around 77 GB for Graph and Stream (Overall size 137GB)
2. [ extra 60GB document, BRS, Logs, stats, entities etc.]
3. 1M max product in any store
4. 1900 stores
5. 650K SMP_Parent, images, status
6. 9.3M marketplace data
7. Around 3X+ data as compared to Streamoid Production Database
Machine
- Cloud: GCP
VM: c2-standard-16 ,
RAM: 64GB
CPU: 8 Core, 16vCPU
Disk: 500GB SSD Persistent disk
OS: Ubuntu 18.04 LTS
Arch: x86/64, AMD
Client
- Content-Type: application/json, Content-Type: text/plain
- Connection: keep-alive
- Access-Control-Allow-Origin: *
- Access-Control-Allow-Methods: *
- Access-Control-Allow-Headers:*
- Vary :*
- Access-Control-Max-Age:3600
- x-bang-api-key: <api_key>
All tests are done using REST APIs. The C++, Java clients could be used for far better performance, but the Catalogix works using REST API hence we used the same.
Protocol: HTTP 1.1
Methods: HEAD, GET, POST, PUT, DELETE
Supported Headers
Binary data or object should be passed with base64 encoding using Content-Type: text/plain
There is a separate document which describes the queries and API details, attached with this doc
Below are several sections detailing the different runs for performance benchmark.
Queries [ Read Operations ]
The queries used are the ones that are run on Catalogix all the time for various interactions. To compare the performance numbers for these queries with Catalogix and BangDB, following dataset was used.
- Catalogix 200 Store with 134K products
BangDB 200 Store with 134K products
BangDB POC Store with 1M products
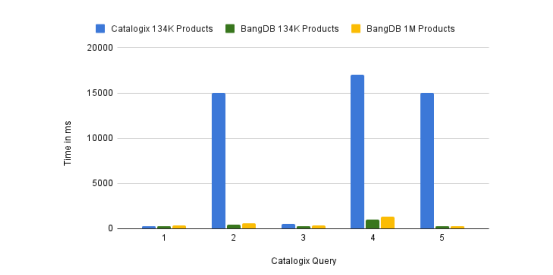
The queries and their execution time in milli-sec (excluding the Network time) are as follows;
| Num | Query | MongoDB 134K Products | BangDB 134K Products | BangDB 1M Products |
|---|---|---|---|---|
| 1 | Get variation, style and total products for a store | 275 | 316 | 318 |
| 2 | Get 50 products for a given store - UI first query | 15000 | 402 | 601 |
| 3 | Get custom and marketplace data for a given product | 500 | 309 | 347 |
| 4 | List product for a store in ascending modified date | 17000 | 976 | 1300 |
| 5 | Fetch select attributes for product of a store | 15000 | 238 | 277 |
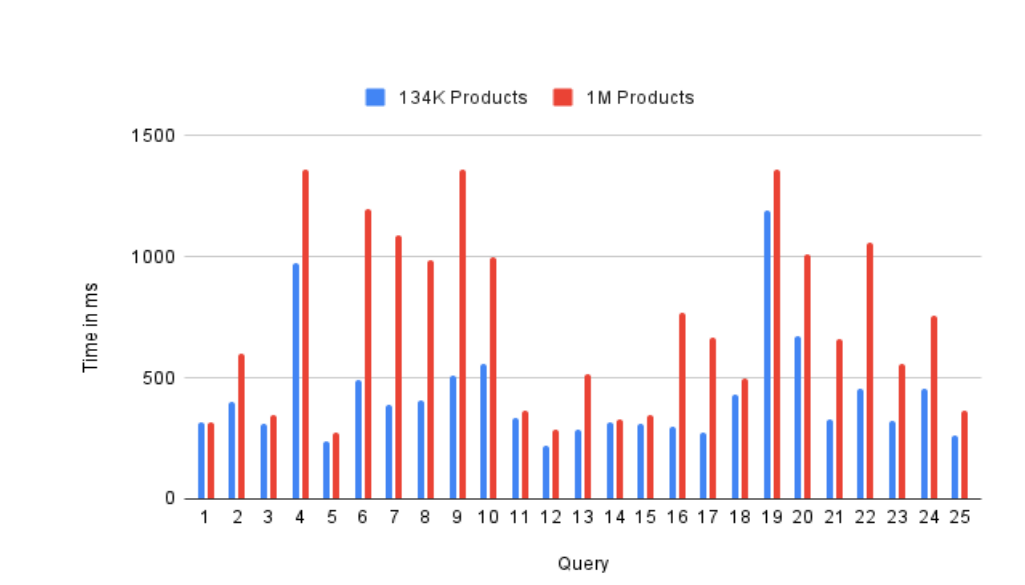
Since we had only these queries being used at Catalogix, so we ran more queries on BangDB and below are their performance numbers (time in milli sec)
| Num | Query | 134K Products | 1M Products |
|---|---|---|---|
| query 1 | Get variation, style and total products for a store | 316 | 318 |
| query 2 | Get 50 products for a given store - UI first query | 402 | 601 |
| query 3 | Get custom and marketplace data for a given product | 309 | 347 |
| query 4 | List product for a store in ascending modified date | 976 | 1360 |
| query 5 | Fetch all attributes for product of a store | 238 | 277 |
| query 6 | Fetch select attributes for product of a store | 489 | 1200 |
| query 7 | Fetch data in rel with conditions | 390 | 1090 |
| query 8 | Fetch product groups (SMP_Parent) for a store | 410 | 987 |
| query 9 | Count total product_groups for a store | 511 | 1360 |
| query10 | Chain query to get store, product and SMP data | 560 | 996 |
| query11 | Required fields and SMP fields | 334 | 365 |
| query12 | Query for total stores count | 217 | 287 |
| query13 | Fetch all data for a store node (can have config file and other attribute level details as node properties) | 284 | 517 |
| query14 | Fetch details for a particular store | 316 | 330 |
| query15 | Count for related stores | 309 | 347 |
| query16 | Fetch shared stores SMP data | 298 | 770 |
| query17 | Get total num of products | 276 | 668 |
| query18 | Fetching 50 random products | 430 | 495 |
| query19 | Fetch all product related to a group | 1190 | 1360 |
| query20 | Filter condition on chain query - returns selected fields | 674 | 1010 |
| query21 | Fetch selected data for all images related to a store | 329 | 659 |
| query22 | Get all images nodes | 456 | 1060 |
| query23 | Fetch status and product_group (SMP_parent) details for a store | 324 | 560 |
| query24 | Fetch product details and status details | 453 | 760 |
| query25 | Fetch given marketplace data for a store | 265 | 364 |
The above were numbers for read operations, now in next section, we will go into write performances.
Write Operations
This section will cover the write operations and its throughput, performance numbers while data ingestions, insert, and updates. Following are the details for the test.
The benchmark test for write was done for Product data, Marketplace data and Status data. The test was run with following details.
- Num of parallel simultaneous connections: 8 [ DB used 8 threads]
Method: POST, REST
We selected these data for various reasons. Product data write is heavy as it involves 13 write operations and 9 read operations to insert just one record. Whereas Marketplace data is moderate, and it requires just 13 write operations and no read at all. Finally, status data is light weight since it involves only 2 write operations and no read for inserting one status record.
The data was split into multiple parts and the summary of each part as mentioned in the appendix.
Product data
1. product_details_1_1.json - 224.6MB
2. product_details_1_2.json - 224 MB
3. product_details_1_3.json - 111.8 MB
4. product_details_1_4.json - 111.8 MB
5. product_details_1_5.json - 111.9 MB
6. product_details_1_6.json - 111.9 MB
7. product_details_1_7.json - 111.9 MB
8. product_details_1_8.json - 111.9
Market place data
1. amazon_1.json - 219.9 MB
2. marketplace_1.json - 188.5 MB
3. marketplace_1_3.json - 181.8 MB
4. marketplace_1_4.json - 36.4 MB
5. marketplace_1_5.json - 92.6 MB
6. marketplace_1_6.json - 92.6 MB
7. marketplace_1_7.json - 181.8 MB
8. marketplace_1_8.json - 36.3 MB
status data
1. status_details_1.json - 10.1 MB
2. status_details_1_2.json - 10.1 MB
3. status_details_1_3.json - 6 MB
4. status_details_1_4.json - 9.4 MB
5. status_details_1_5.json - 6 MB
6. status_details_1_6.json - 4 MB
7. status_details_1_7.json - 6 MB
8. status_details_1_8.json - 4 MB
Following are the summary of the test.
| Data | Num of rows | Size (MB) | Time (Sec) | IO ops per record | Event/sec | IOPS | MB/sec |
|---|---|---|---|---|---|---|---|
| Product | 1000000 | 1068 | 728 | 22 | 1374 | 30220 | 1.47 |
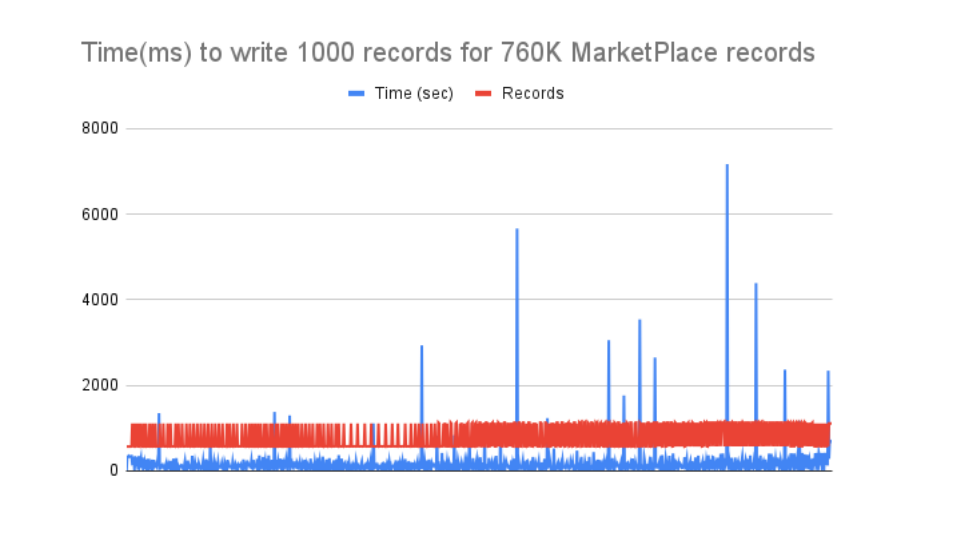
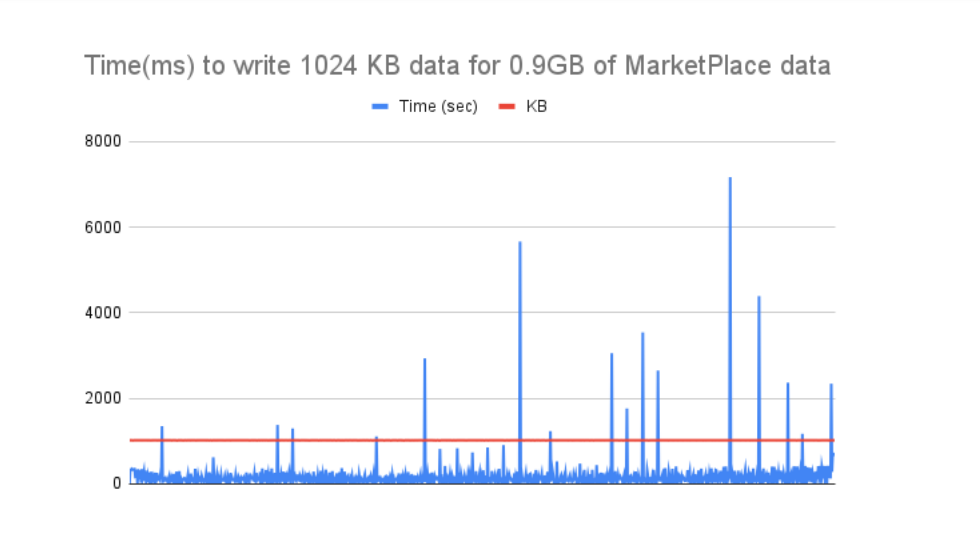
| MarketPlace | 760000 | 982 | 172 | 13 | 4419 | 57442 | 5.71 |
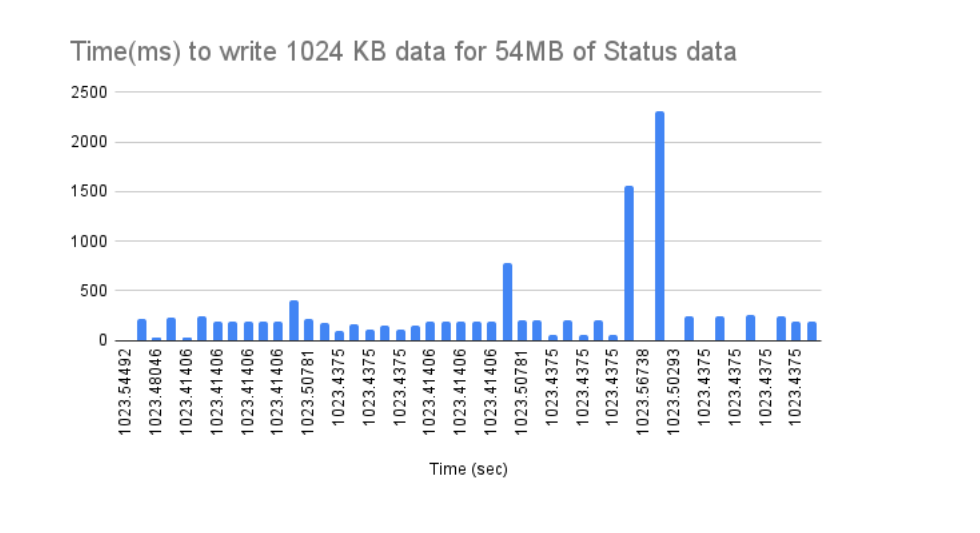
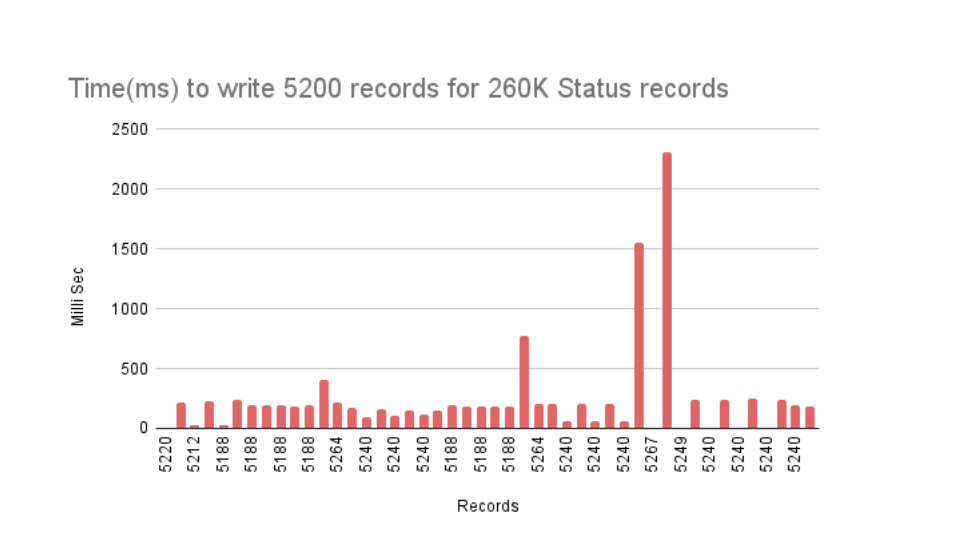
| Status | 260000 | 54 | 11 | 2 | 23636 | 47273 | 4.91 |
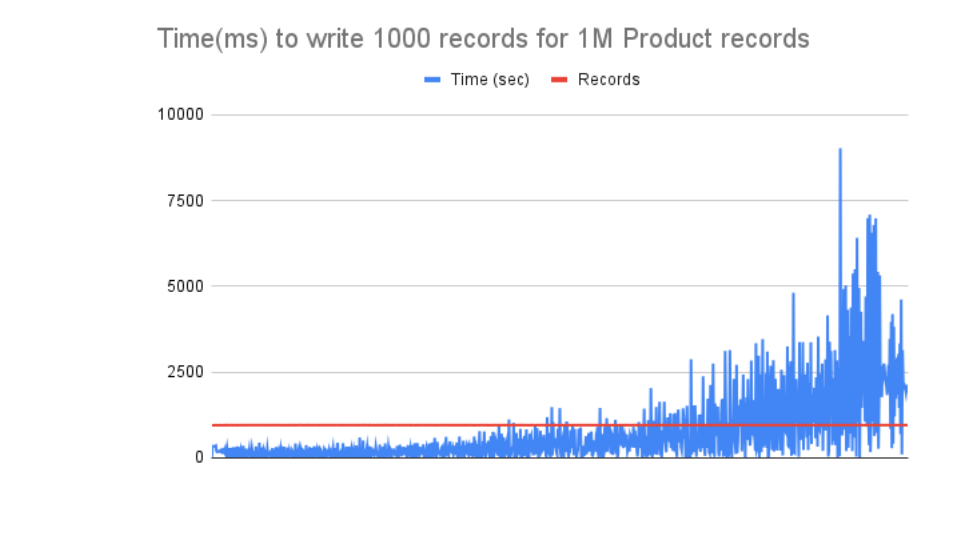
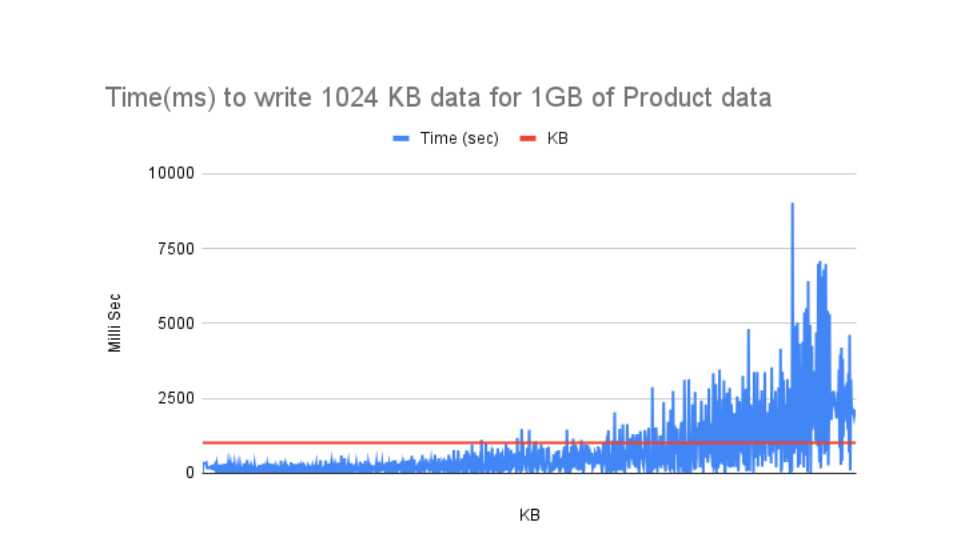
Below are the charts depicting the behaviour of the operations from beginning to end.
Product Data
MarketPlace data
Status data
Summary
- For Catalogix use case perspective, BangDB eliminates the bottleneck of low performance as it’s ~10-15X faster on an average for slower queries over there.
- BangDB also eliminates the middle app layer where various computations happen, reason for the low performance as app was doing the DB job.
- For read query, BangDB performs and scales well for even 3X of prod size data.
- BangDB allows data to grow beyond memory and still work efficiently. This may allow user to maintain and scale gracefully.
- The write operations with mixed reads as well, scales well. It provides high IOPS for concurrent write of different kind of data in continuous manner. Therefore, it will allow users to perform read and write in random and mixed manner with high performance.
- Catalogix integration should be simple as there are only 5 queries for which it needs to make changes at the FE level.
- There are more features withing BangDB that could be utilized in coming days. Verifications, ETL, Filter, running join, CEP, auto ML etc. are few for example.
- There are quite a few scope of improvements in the implementation too, but we can optimize later.