Recommendation System
Introduction
Recommendation System is a platform which offers various financial, insurance and healthcare/wellness products and solutions to the customers/users. The discussion in the document is limited to the recommendation system which will help the Recommendation System in serving customers and users in much better/personalized ways. It will also aid the platform in achieving continuously improving and lasting relationships with the customers
The goal of the system is as follow:
- • Recommend one or more new/appropriate product/solutions to the customers, largely based on customers’ profile, behavior, trends, tendencies, desires, and discovery. At the same time, it should also leverage entities, their relationships, similarities within the context.
- It should use Graph, ML, CEP, and continuous stream data analysis techniques for the recommendation purposes.
- Should be the unified data source for customer profile, behavior, and other details and allow queries on the same in different ways.
- Should be able to assess, learn and improve using past data and outcomes.
- It should be an independent scalable service which will cater to the Recommendation System platform and other applications/services as required.
- It should manage the data itself for storage, computations, recommendations, query, and analysis purposes.
- It should allow working with the data that is made available to it. And at the same time, it allows future additions/editions to be ingested and processed smoothly (largely autonomous).
- It should be configurable as much as possible; such that different processing logic could be added/edited as and when necessary.
- It should be linearly scalable to deliver the expected level of performance.
- It can be deployed on cloud or on-prem as desired.
- The entire project is quite large in scope and hence we should be able to add and release in a staggered manner over a period.
The backbone of the recommendation system is in the understanding of the customers. And based on this we must construct a set of mechanisms to serve them better. There are some basic unit-level constructs that we define which form the base for rest of the discussion
- Customer profile
- Customer behavior
There are many other entities here, but the majority of computations happen on these two items.
Customer profile
The following three broad groups would be created using customer profiles.
- Demographic
- Geographic
- Psychographic
Based on these broad groups, we will create several segments that could be used at run time and/or for other processing
Segments for customer profile groups based on
- Age
- Family structure
- Monthly Income
- Family life cycle
- Geo-location
- Interests/hobbies
Customer Behavior
Following data would be used for behavior computations. We will maintain an entity table for the same as well for ready usage of the continuous pre-aggregated data. Most of these data will be part of the Graph itself with different set of relationships between the nodes
- Product (APP) usage history
- Purchase history
Patterns for customer behaviors for various computations
- Engagement
- RFM
- Survey
- Loyalty Index
- Seasonality
- Lifetime value
- Nurture index
Structuring of data
We are basically dealing with several entities and some interactions between those entities with different properties. While recommending the products or solutions, we must ensure that we improve the customer’s/user’s experience. Therefore, it’s imperative that we have a solid understanding of not just the entities but also the context in which they exist. Hence when it comes to storing the data, we need to ensure that
- We have the context also stored in an efficient manner along with entities [ isolated non-related structure is not sufficient, need relations]
- We need relationships or linking of entities but at the same time we need to have scalable and flexible model [ Can’t use RDMBS, need to break the cold coupling]
- We should be able to add as many links (relations) as required without changing anything which is existing
- We should be able to query the database using these relationships along with various other constraints related to entities and relations properties
- We should be able to pre-compute several properties and attach these entities so that we could query and use them at run time
- The structure should keep evolving as more and more entities and relations arrives
- We should be able to find related entities given a set of entities and set of relationships
- we should be able to find similarities between any given set of entities and use that for recommendation
- We should be able to discover link two isolated entities in an efficient manner
- We should be able to find the complex symmetry or asymmetry between given set of entities
- We should be able to do time series data ingestion and processing for continuously update and evolve the structure and keep continuous statistics / aggregation happening for run time efficiency
- We should be able to maintain and continuously update the long-term data for entities such that these could be leveraged at run time
- We should be able to train models on the data existing within the structure such that the models keep updating itself in continual manner and update the existing structure automatically.
- Customer Profile - Demographic, Geographic, and Psychographic segmentation.
- Customer Behavior - Purchase history, engagement levels, and loyalty metrics.
- Graph-based Structuring - Leveraging entity relationships for better recommendations.
- Continuous Event Processing - Real-time data transformation and enrichment.
- Machine Learning Models - Clustering, classification, and collaborative filtering.
Therefore, we will have to use a combination of the following.
- Graph store for entities and relationships along with various other defined or computed properties along with ML integration for prediction (batch or runtime)
- Stream processing for ETL, continuous aggregation, running statistics, complex event processing, data-enriching, and long-term entity based pre-aggregated data
Graph Store
The graph store will have entities and they will be connected through relationships. Entities – immutable id, with flexible/updateable properties Relations – fluid, flexible, directional, dynamic
There are two basic aspects to the graph structure, raw data graph and computed data graph
- Basic entities and its relations with several other dissimilar existing entities
- Entities and relations with other set of other entities with existing relations
- Entities and relations with several computed entities
- Entities and relations with other set of entities with computed relations
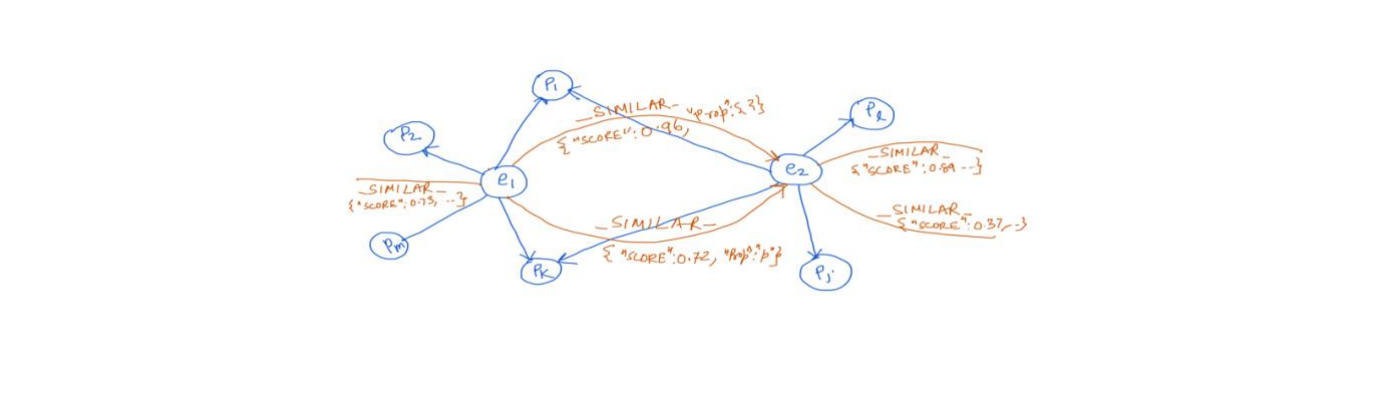
- Entities and their relations with similar entities with appropriate strengths
- Entities and their groupings based on many different sets of dimensions
- Entities and the clusters
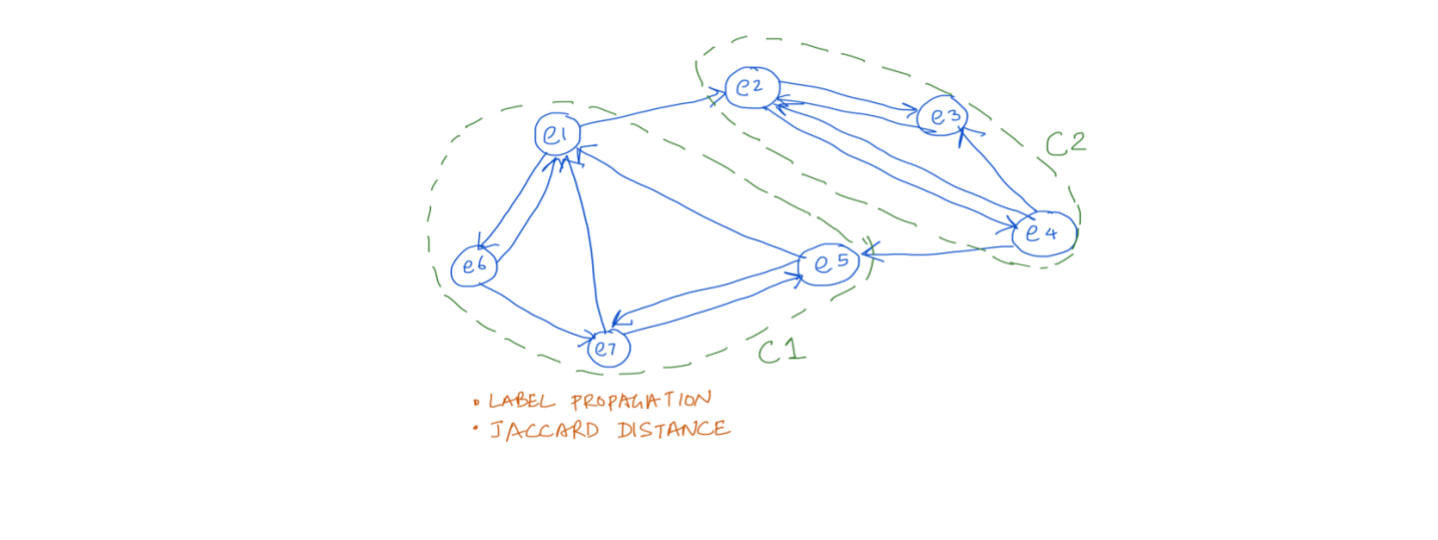
While (a) & (b) are mostly driven by the input data (the raw data). Whereas (c), (d), (e) etc. are data enriched by several mechanisms, like “catr”, “join” etc. by event processing, clustering, similarity, common groupings, community detection through label propagation, path finding, centrality etc. in graph processing along with bringing the whole set of ML algos to the Graph and Event processing as required.
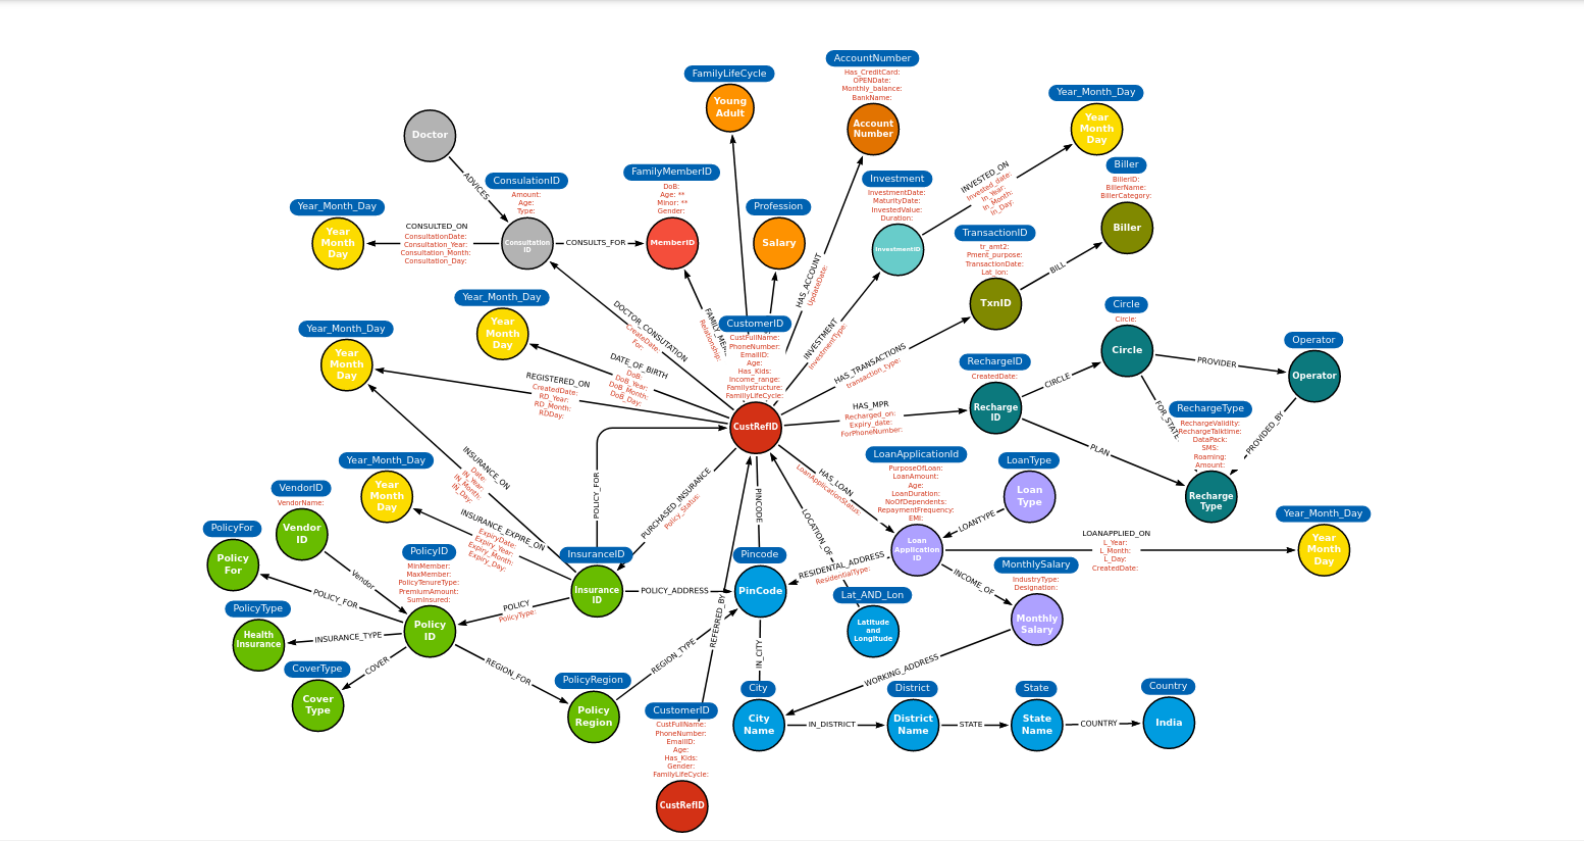
Let’s look at the graph structure (subject to change (most likely it will by 20-30%)) which depicts largely (a) & (b) as defined above
ETL, running stats, continuous analysis using “Event processing”
One of the most difficult and heavy tasks for such processing is ETL and it’s widely recognized that sometimes we spend the majority of our time in ETL to try to get it right, otherwise a heavy penalty awaits if even a minor thing goes wrong at the beginning. BangDB avoids this process to great extent by implementing continuous data ingestion mechanism along with processing that could be done to extract and transform what we need at any given time. Here are some of the benefits of using this for the project
Data Processing and Analysis
The system integrates Graph Store and Stream Processing for efficient data handling. Graph structures are enriched with computed relationships and analyzed using ML techniques like clustering, association rule mining, and collaborative filtering.
- Load data in batch or event manner, as it is, without requiring changing anything in the data.
- Transform the data using schema config (“catr”, computed attribute). There are dozens of built-in default functions to leverage for such transformation. Further we can write our own UDFs for custom transformations as required. Going beyond, we can simply attach an ML model to add predicted value as part of the event
- We can run CEP to find interesting patterns (in absolute manner) and send the data to another stream, graph as needed. This hugely enriches the data structure.
- We can join, refer, and filter events based on queries, conditions, and state to enrich the data structure.
- Continuously update the underlying Graph Store as data arrives. Since we have plenty of methods to add/transform the data within the event processing framework, the graph receives a lot more enriched data along with raw events which makes the structure way more valuable.
- Running statistics could be simply used for different attributes and aggregated over different dimensions for as low as second granularity (to min, hour, and any length of time). These can be further rolled up as we need and used for various queries. Note that, doing this on a normal database is a super costly affair, but it’s extremely fast and efficient due to continuous processing vs batch processing (SQL or MapR) .
- Stream maintains even entity table for long term aggregated data along many different dimensions which are readily available for consumption, which otherwise takes hours and days to compute .
- Time-series analysis of data is natural and inbuilt by default, and platform supports taking auto actions as configured
Concepts and algorithm
1. Entities cluster Analysis within Graph and similarity scores. This is template for similarity based on feature set X
- The entities along with relationships and properties in many different combinations will be used to find out the clusters within the data using K-means
- Then further similarity scores will be computed based on various assigned centroids and distance from them, frequency, and aggregations of various features along with few configurable inputs
- These scores would further be stored in the graph for run time usage for various computations
- The entire processes would be continual in nature, and it will self-adjust the scores as more data arrives
2. Association rule mining using natural Graph properties
- Association rule mining is used to identify the relationships among the set of items/entities within the database. These associations are based on cooccurrence of the data items. Therefore, main purpose of the association rules is to find out the synchronous relationships by analyzing the data and use this as reference during decision making
- Collection of items, A ={a1, a2, …} and group of transactions T = {t1, t2, …} (Set of items) would be stored in the graph as entities and relations such that the value Conf is computed and stored in the graph for the purpose of finding if X is purchased, then Y can also be purchased with the confidence Conf. The confidence is a measure of the number of evidence of the events when X is bought then Y is also bought.
- The scores/Conf will be stored in the graph itself such that these can be used at run time for decision making. Again, this will also be self-maintaining as we will schedule the computations for re-eval and update
- Further we will attach model trained using Apriori algorithm within the graph for run time predictions
3. Customer segmentation based on cluster analysis
- Customer segmentation is the process of grouping customers together based on common characteristics. The natural graph structuring will provide a much richer feature set for the training purposes where the entire effort of feature selection, cleaning, correlation, etc. will be avoided. Further models could be trained automatically with defined frequencies and linked within the graph for run time predictions as well
- Graph inbuilt clustering mechanisms, groups identifications should be leveraged for this as these are evolving continuously and very fast in nature. We can also train ML models explicitly using the set of the features already pre-baked in the graph .
- For recommendation engine_1 we are planning to cluster users based on their Language, Gender, Age, City, State, dependency, Marriage status, and education. The result of clustering will be given to the collaborative filtering recommendation system.
- Mix of Centroid-based K-means Clustering, Centroid-based Mini-Batch K-means Clustering and Distribution-based Gaussian mixture model will be used
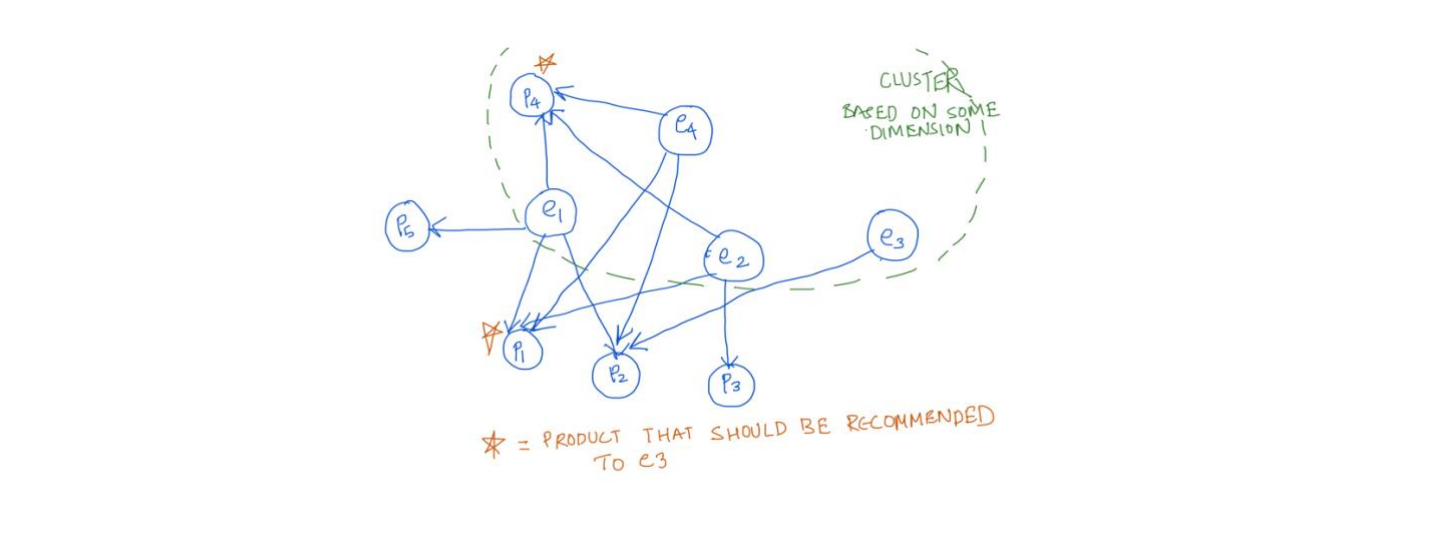
4. Collaborative filtering for set of features which has fixed and limited set of values to identify similar users – coupled with graph it makes it very effective
- Collaborative filtering filters information by using the interactions and data collected by the system from other users. It's based on the idea that people like things similar to other things they like, and things that are liked by other people with similar taste. Graph query will be used for the larger purposes however for certain cases we will also train models and use that for finding the similar profiles
- The Collaborative filter technique works by building a matrix for attributes of the user. The matrix is then used to match users with relevant interests and preferences by calculating similarities between user profiles. A group of such users is called a neighbourhood. A user receives recommendations for products that have been brought by the neighbourhood.
- Without the presence of graphs, collaborative based recommenders take time to learn about new users and their relationships with each other or with other entities. Graph provides the data in pre-baked manner for it to be efficient from the start
5. Classification model
- For Loan recommendation we will be using a Classification model to predict the probability of a customer to apply for a loan. They will recommend a loan based on the probability value from the model.
- For the dataset we know that approx. 1.5 % of the customers apply for a loan. The dataset is small and highly imbalanced. Therefore, for the classification model will use
- Logistic Regression - simple and efficient algorithm. Provides probability score for observations
- Naive Bayes - performs better on less training data, very fast
- SVM - can work well on small data and very efficient
- Decision Tree
6. Popularity based / Trend based
- It is a type of recommendation system which works on the principle of popularity and or anything which is in trend. These systems check about the products which are in trend or are most popular among the users and directly recommend them.
- With a graph and entity table in stream, we can provide the list of products with a high number of sales, views, engagements group-by geo-loc, age range groups etc. These data could be leveraged directly
- Further we will train set of models for predicting the recommendations. To make it a little personalized we will use demographic information as part of the feature set as well .
7. Seasonal based
- Need to use the aggregated data on the week/month wise purchases from the stream entity table and then store these in the graph with additional relations (and their properties)
- Graph query to retrieve the data with filters based on current season/month/week for users who made transactions previously